System status
This page shows the overall condition of the Logmanager platform. Here you will find information regarding:
- System Health and Performance
- Database Performance
- Network Information
- NTP status
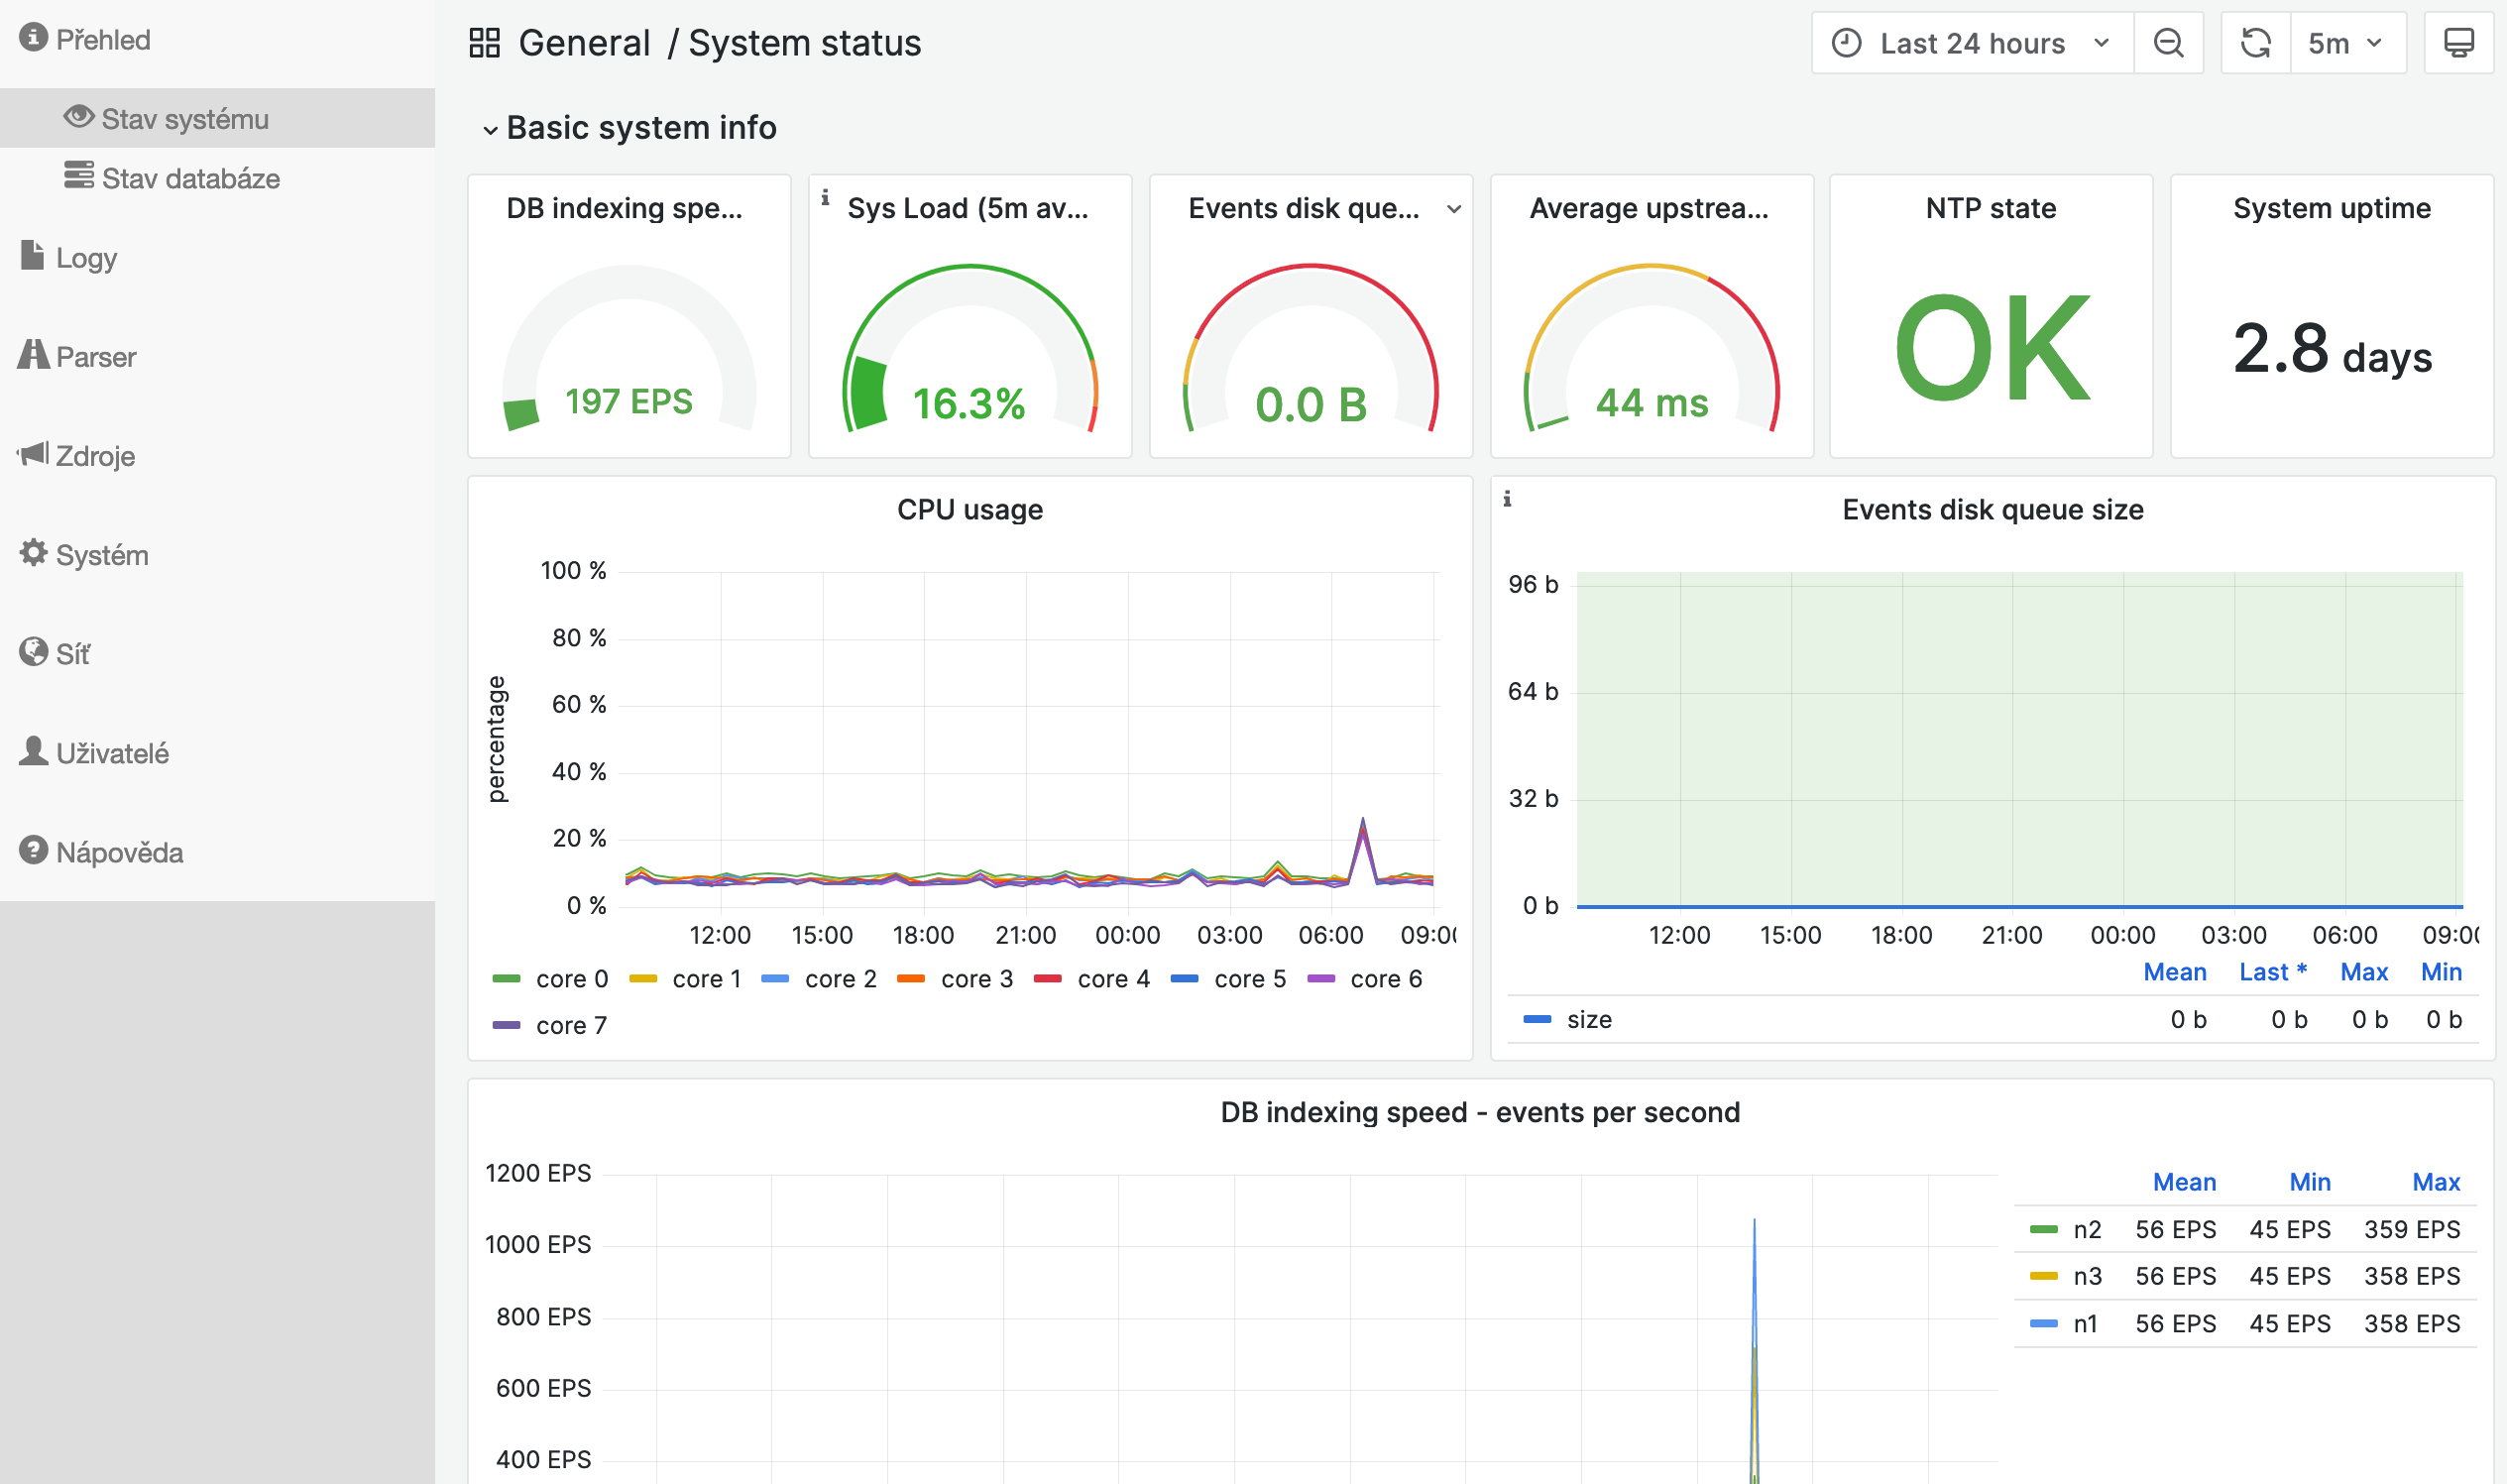
System Status
Grafana provides the system information for Logmanager’s dedicated system status page. If you would like more information on how to interact with these graphs, please see the official Grafana documentation.
The following graphs are available for checking system health and performance:
- Sys load (updated every 5 minutes - user adjustable)
- CPU Usage (Updated every 25 minutes - user adjustable)
- IPMI address information
- System temperatures over time
- Power Consumption
- Disk space
- Disk Average Wait Time
- Disk IOps Completed
The following graphs are available for different metrics related to the Logmanager database:
- DB indexing speed
- Events disk queue size
- Events disk queue size for the past 12 hours (Updated every 10 minutes - user adjustable)
The following graphs are available for networking and DNS:
- Interface status
- Network traffic
- DNS response time
- DNS response codes
This part provides detailed information regarding the synchronization state with provided NTP time server:
- Overall status. Possible states:
- ok
- failed
- NTP server peer address (IP or hostname).
- Selection status. Possible states:
- Synced – The system clock has been synchronized.
- Not selected – Failover NTP server ready to be synchronized.
- Unreachable – The system couldn’t reach the NTP server.
- Stratum hierarchy level.
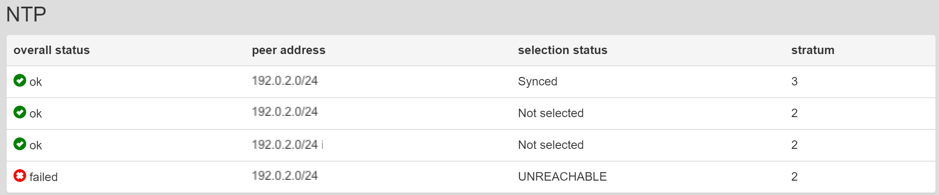
NTP server