Dashboards
This section is used for working with data available in the database: view, analyse, correlate, etc. It is based on Kibana, which provides an intuitive interface and robust tools for flexible analytics, visualization, real-time summary and charting of log data. You can create graphs of different types (bar, pie, table), histograms to present events over time, calculate trends, show IP addresses in a world map and more.
A single dashboard contains a collection of graphs, which show data based on input queries and filters. You can create different dashboards based on your needs.
Introduction dashboard is a default landing page for Dashboards menu. It shows a set of default dashboards:
- Universal dashboards.
- Windows events.
- Fortigate events.
- Office 365 events.
- ISO 27001:2013.
- and many more.
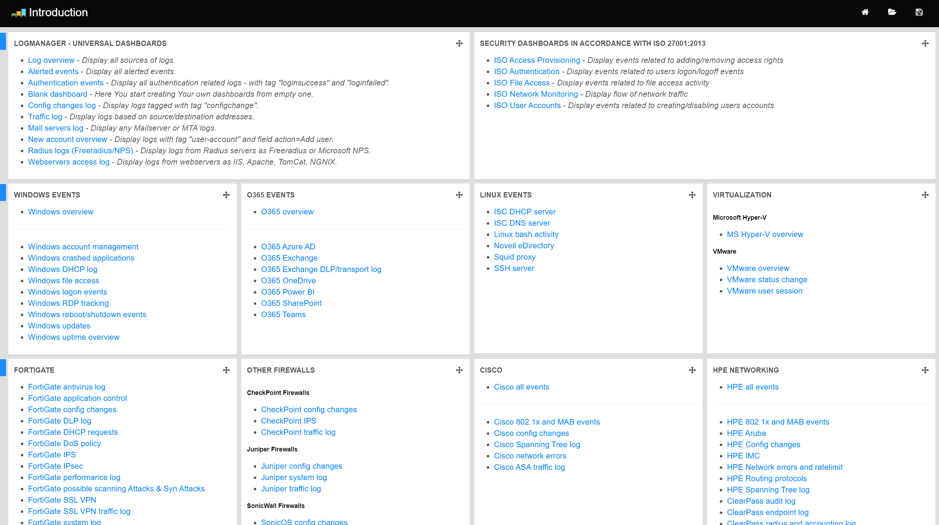
Introduction dashboard
You can choose to use different landing page, by navigating to a dashboard of your choice and setting it as “home”.
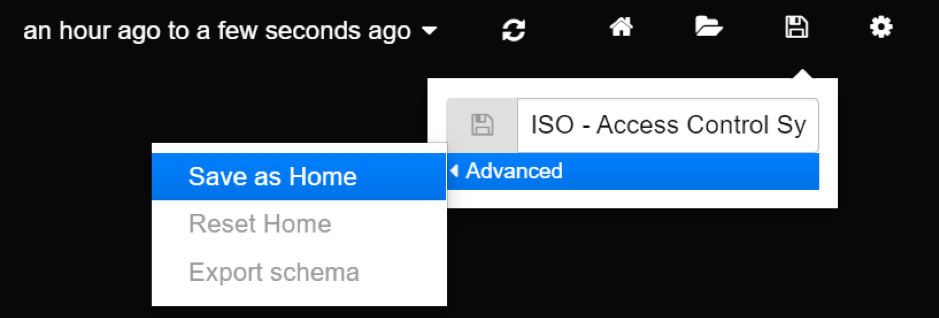
Setting new default landing page
Logging overview dashboard provides a quick insight into all available data. It runs a query “*” which will instruct the database to return everything it has in the given time interval (which by default is set to 1 hour). In conclusion, this view will show all logs saved in the database in the last hour. It contains several different graphs:
- Events over time - information about time of event receive and total amount of events in given interval.
- Device name - top 25 values in field meta.src.host.raw.
- Device IP - top 25 values in field meta.src.ip.
- Tags - top 25 values in field meta.tags.
- Parser name - top 25 values in field meta.parser.
- Syslog program name - top 25 values in field meta.src.program.
- Syslog severity - top 25 values in field meta.src.severity.
- and All events - full messages (received logs) listed from newest to oldest.
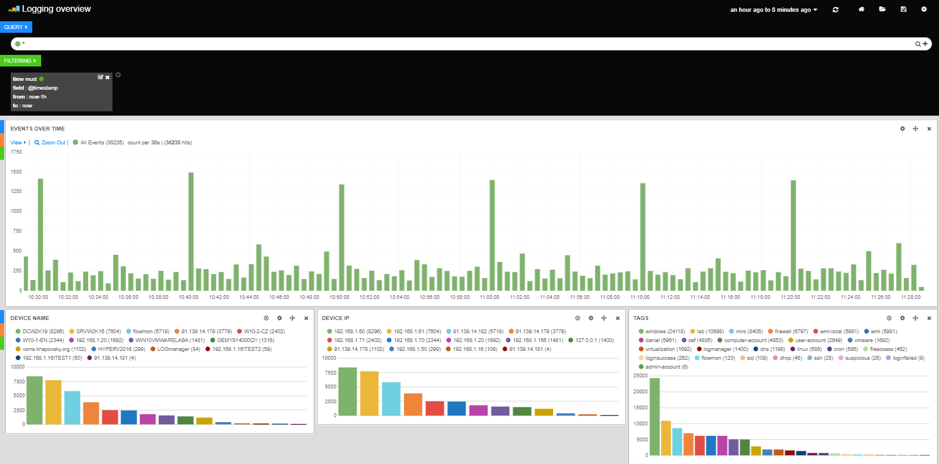
Introduction dashboard
Queries can be run via the query input at the top of the page.
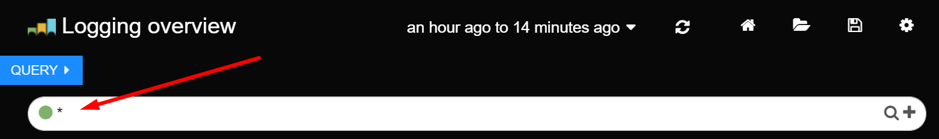
Queries
Example of a very simple query:
to be or not to be
The search we have actually performed is: to OR be OR or OR not OR to OR be.
We can also match the entire phrase:
"to be or not to be"
Or in specific fields:
line_id:86169
We can express complex searches with AND/OR, note these words must be capitalized:
food AND love
Or parentheses:
("played upon" OR "every man") AND stage
Numeric ranges can also be easily searched:
line_id:[30000 TO 80000] AND havoc
And of course to search everything:
*
Where the status field contains active:
status:active
Where the title field contains quick or brown. If you omit the OR operator the default operator will be used:
title:(quick OR brown)
title:(quick brown)
Where any of the fields book.title, book.content or book.date contains quick or brown (note how we need to escape the * with a backslash):
book.\*:(quick brown)
Where the field title has no value (or is missing):
_missing_:title
Where the field title has any non-null value:
_exists_:title
The query string is parsed into a series of terms and operators. A term can be a single word (quick or brown) or a phrase, surrounded by double quotes (quick brown) which searches for all the words in the phrase, in the same order.
Operators allow you to customize the search. The available options are explained below.
The default_field is searched for the search terms, but other fields can also be specified in the query syntax:
Where the status field contains active:
status:active
Where the title field contains quick or brown. If you omit the OR operator the default operator will be used:
title:(quick OR brown)
title:(quick brown)
Where the author field contains the exact phrase “john smith”:
author:"John Smith"
Where any of the fields book.title, book.content or book.date contains quick or brown (note how we need to escape the * with a backslash):
book.\*:(quick brown)
Where the field title has no value (or is missing):
_missing_:title
Where the field title has any non-null value:
_exists_:title
Wildcard searches can be run on individual terms, using "?" to replace a single character, and "*" to replace zero or more characters:
qu?ck bro*
Be aware that wildcard queries can use an enormous amount of memory and perform poorly — just think how many terms need to be queried to match the query string “a* b* c*” .
Allowing a wildcard at the beginning of a word (eg *ing) is particularly heavy, because all terms in the index need to be examined, just in case they match. Leading wildcards can be disabled by setting allow_leading_wildcard to false.
Wildcarded terms are not analyzed by default. They are lowercased (lowercase_expanded_terms defaults to true), but no further analysis is done, mainly because it is impossible to accurately analyze a word that is missing some of its letters.
However, by setting analyze_wildcard to true, an attempt will be made to analyze wildcarded words before searching the term list for matching terms.
We can search for terms that are similar to, but not exactly like our search terms, using the “fuzzy” operator:
quikc~ brwn~ foks~
This uses the https://en.wikipedia.org/wiki/Damerau-Levenshtein_distance to find all terms with a maximum of two changes, where a change is the insertion, deletion or substitution of a single character, or transposition of two adjacent characters.
The default edit distance is 2, but an edit distance of 1 should be sufficient to catch 80% of all human misspellings. It can be specified as:
quikc~1
While a phrase query (eg “john smith”) expects all of the terms in exactly the same order, a proximity query allows the specified words to be further apart or in a different order. In the same way that fuzzy queries can specify a maximum edit distance for characters in a word, a proximity search allows us to specify a maximum edit distance of words in a phrase:
"fox quick"~5
The closer the text in a field is to the original order specified in the query string, the more relevant that document is considered to be. When compared to the example query above, the phrase “quick fox” would be considered more relevant than “quick brown fox”.
Ranges can be specified for date, numeric or string fields. Inclusive ranges are specified with square brackets [min TO max] and exclusive ranges with curly brackets {min TO max}.
All days in 2012:
date:[2012-01-01 TO 2012-12-31]
Numbers 1..5:
count:[1 TO 5]
Tags between alpha and omega, excluding alpha and omega:
tag:{alpha TO omega}
Numbers from 10 upwards:
count:[10 TO *]
Dates before 2012:
date:{* TO 2012-01-01}
Ranges with one side unbounded can use the following syntax:
age:>10
age:>=10
age:<10
age:<=10
To combine an upper and lower bound with the simplified syntax, you would need to join two clauses with an AND operator:
age:(>=10 AND <20)
age:(+>=10 +<20)
The parsing of ranges in query strings can be complex and error prone. It is much more reliable to use an explicit range filter.
Use the boost operator "^" to make one term more relevant than another. For instance, if we want to find all documents about foxes, but we are especially interested in quick foxes:
quick^2 fox
The default boost value is 1, but can be any positive floating point number. Boosts between 0 and 1 reduce relevance.
Boosts can also be applied to phrases or to groups:
"john smith"^2 (foo bar)^4
By default, all terms are optional, as long as one term matches. A search for foo bar baz will find any document that contains one or more of foo, bar, or baz. We have already discussed the default_operator above, which allows you to force all terms to be required, but there are also boolean operators that can be used in the query string itself to provide more control.
The preferred operators are "+" (this term must be present) and "-" (this term must not be present). All other terms are optional. For example, this query:
quick brown +fox -news
- fox must be present.
- news must not be present.
- quick and brown are optional — their presence increases the relevance.
The familiar operators AND, OR, and NOT (also written &&, || and !) are also supported. However, the effects of these operators can be more complicated than are obvious at first glance. NOT takes precedence over AND, which takes precedence over OR. While the + and - only affect the term to the right of the operator, AND and OR can affect the terms to the left and right.
Rewriting the above query using AND, OR, and NOT demonstrates the complexity:
-
quick OR brown AND fox AND NOT news
This is incorrect, because brown is now a required term. -
(quick OR brown) AND fox AND NOT news
This is incorrect because at least one of quick or brown is now required and the search for those terms would be scored differently from the original query. -
((quick AND fox) OR (brown AND fox) OR fox) AND NOT news
This form now replicates the logic from the original query correctly, but the relevance scoring bares little resemblance to the original.
In contrast, the same query rewritten using the match query would look like this:
{
  "bool": {
    "must":     { "match": "fox"         },
    "should":   { "match": "quick brown" },
    "must_not": { "match": "news"        }
  }
}
Multiple terms or clauses can be grouped together with parentheses, to form sub-queries:
(quick OR brown) AND fox
Groups can be used to target a particular field, or to boost the result of a sub-query:
status:(active OR pending) title:(full text search)^2
If you need to use any of the characters which function as operators in your query itself (and not as operators), then you should escape them with a leading backslash. For instance, to search for (1+1)=2, you would need to write your query as (1+1)=2.
The reserved characters are:
+ - = && || > < ! ( ) { } [ ] ^ " ~ * ? : \ /
Failing to escape these special characters correctly could lead to a syntax error which prevents your query from running.
Watch this space
A space may also be a reserved character. For instance, if you have a synonym list which converts “wi fi” to “wifi”, a query_string search for “wi fi” would fail. The query string parser would interpret your query as a search for “wi OR fi”, while the token stored in your index is actually “wifi”. Escaping the space will protect it from being touched by the query string parser: “wifi”.
If the query string is empty or only contains whitespaces the query will yield an empty result set.
In some cases, you might want to compare the results of two separate queries. Dashboards can handle multiple queries by joining them with a logical OR and using the knowledge that they should be treated as separate to influence visualizations.
Click the + to the right of the query input to add another query.
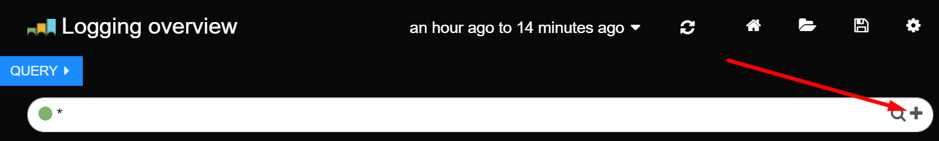
Adding another query
You should now have this:
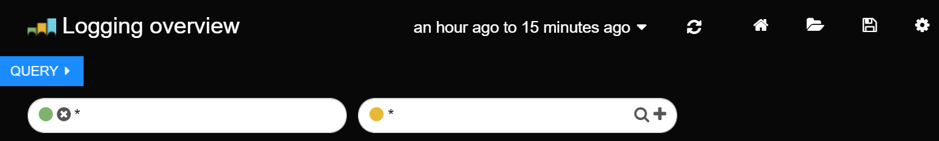
Adding another query
In the left-hand, green input, type "to be" and in the right, yellow input, type "not to be". This will search for every document that has "to be" OR "not to be" in it, and break that down on our hits pie chart. So we go from a big green circle to pie chart:
Multiple queries
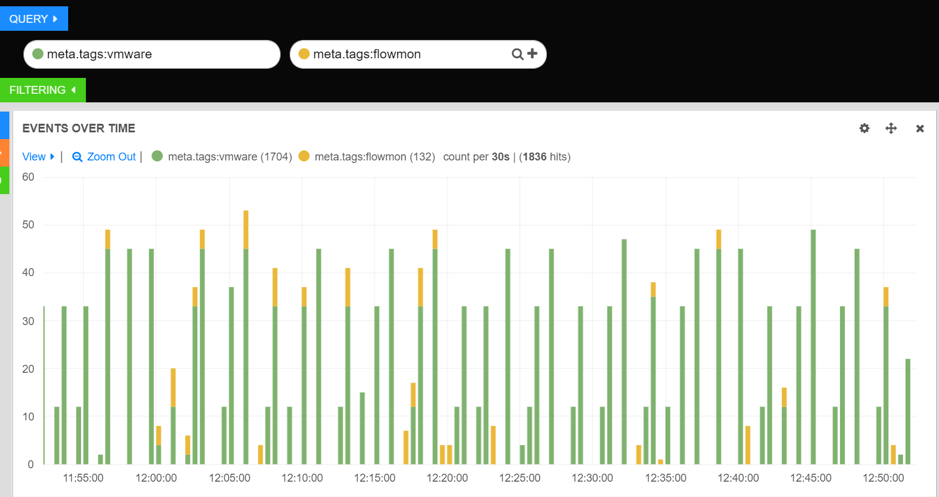
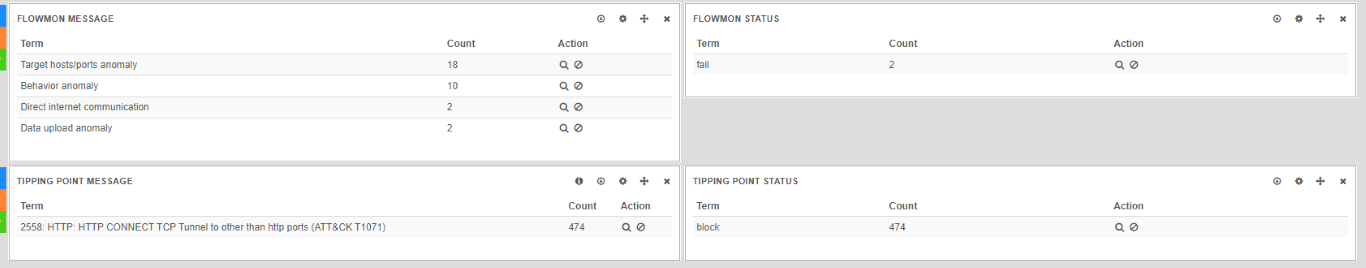
Using multiple queries is especially useful when you want to present different query results on different graphs. For example, you can use this functionality to present data coming from two security sources (in this example Flowmon and Tipping point):
Working with multiple queries 1
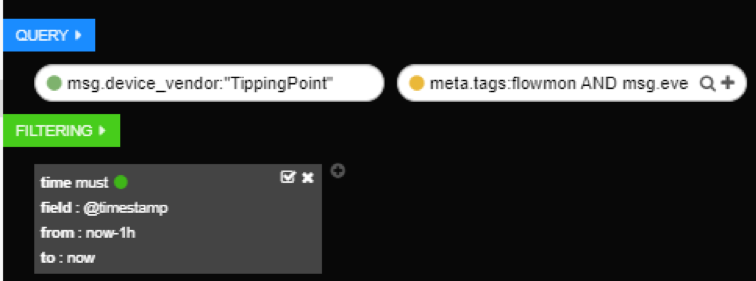
First, green query, will return results for Tipping point (field msg.device_vendor has to have value TippingPoint), and second, yellow query, will return results for Flowmon (field meta.tags has to have value Flowmon).
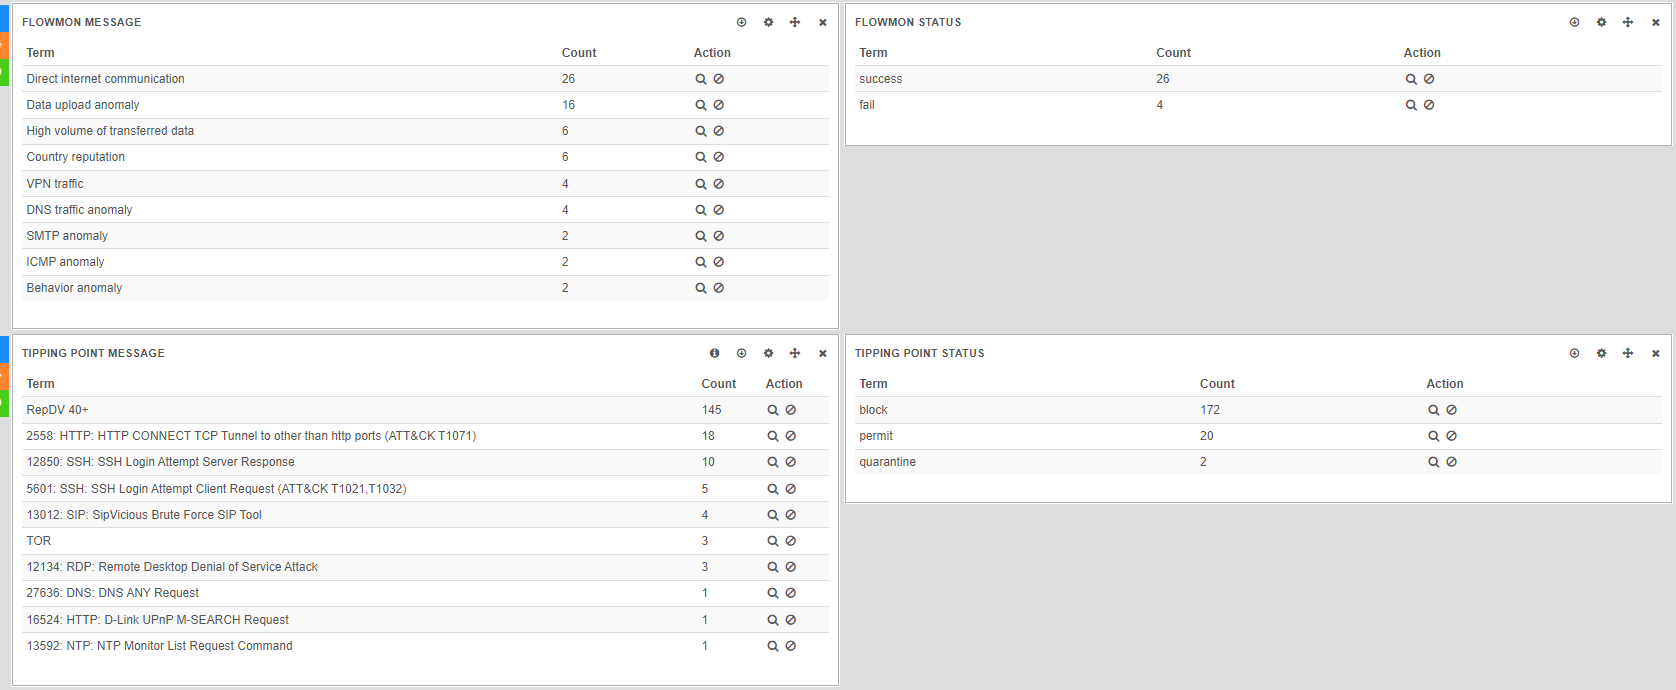
Working with multiple queries 2
Then you can select which dashboard will show which query result. Here graphs “Flowmon message” and “Flowmon status” show results of yellow query while graphs “Tipping point message” and “Tipping point status” show results of green query.
Such view enables visual correlation — we can filter this down to selected source/destination IP and analyse it from point of view of two different sources.
Working with multiple queries 3
To select which graph will show which query result, we must configure it, by clicking on the small gear icon:
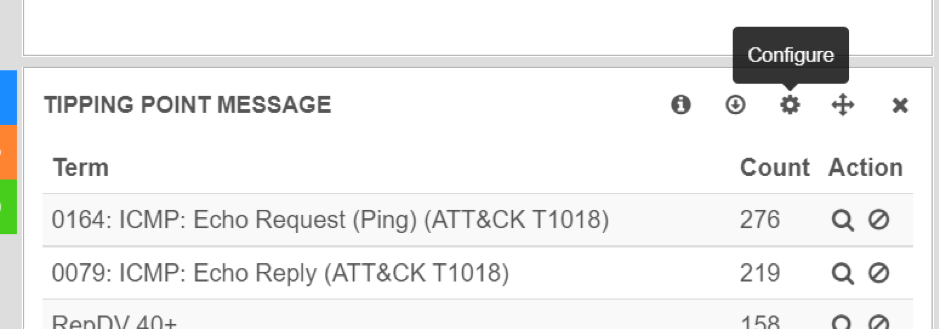
Tipping Point Message
Then we move to “Queries” panel and from the drop-down list choose “selected”. Then just select whichever query result you wish to present to this graph.
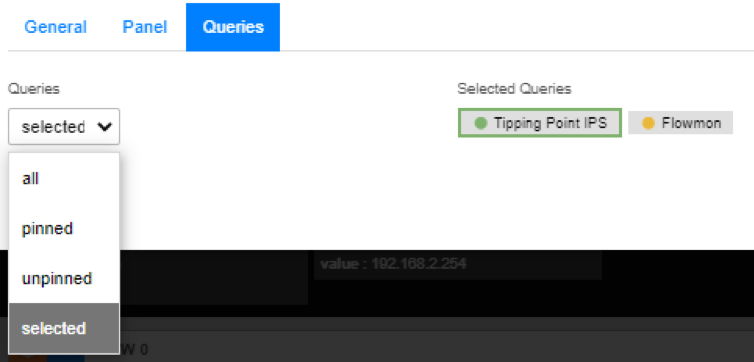
Queries Panel
To remove a query, click the X icon that appears when you mouse over the query input field:
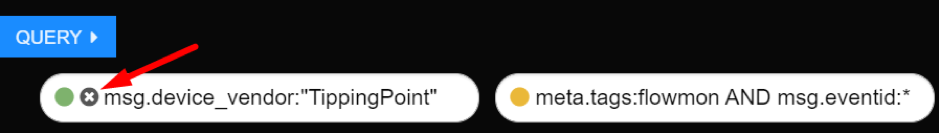
Remove a query
Dashboards will automatically determine a color to use for your queries, but you can set your color explicitly if you want by clicking the colored dot associated with the query. This will open the query settings drop down. From here you can change the color of the query or set a new query name (Legend value) for the histogram.
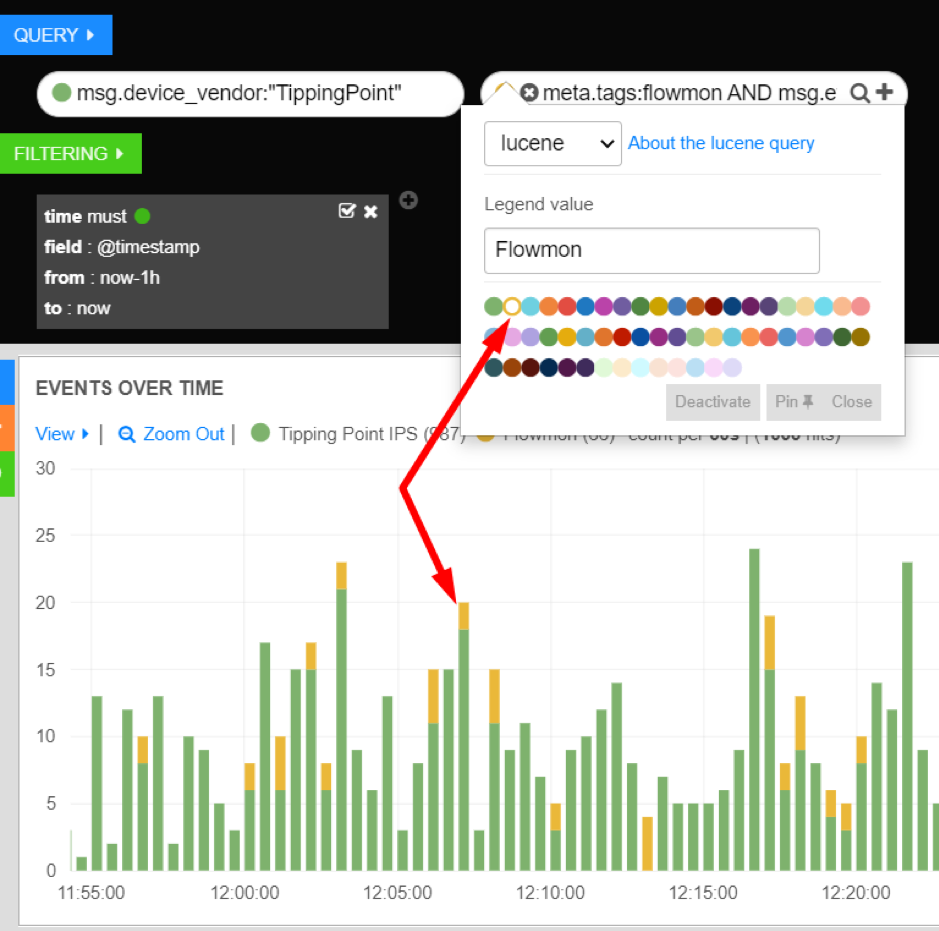
Colors and Legends
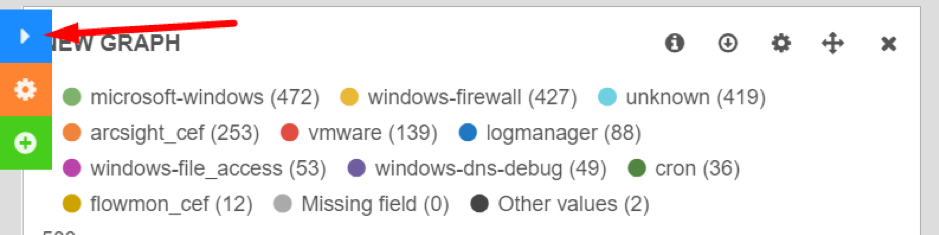
Many Dashboards graphs are interactive and can be used to filter the view of your data. For example, clicking on the green dot next to a value on a bar graph will generate a new filter.
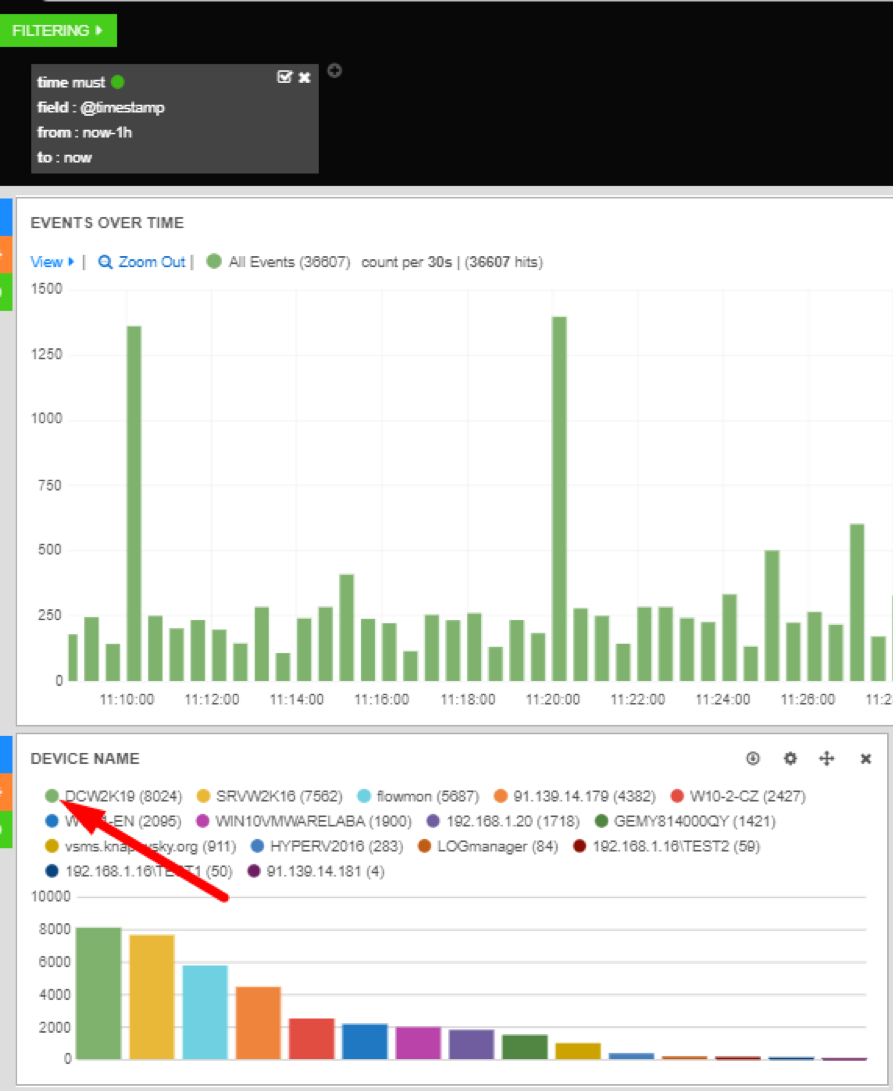
Filters
As you can see, the chart has become one big green bar. This is because a filter was added to match the value you clicked. In this case it was DCW2K19 (Domain Controller hostname) in the meta.src.host.raw field.

Filters 2
From the filtering panel filters can be added, edited, toggled and removed. Many graphs provide the possibility to add filters by clicking on a given value, including terms, table, histogram, map and others.
Filters can also be added manually by clicking the +.
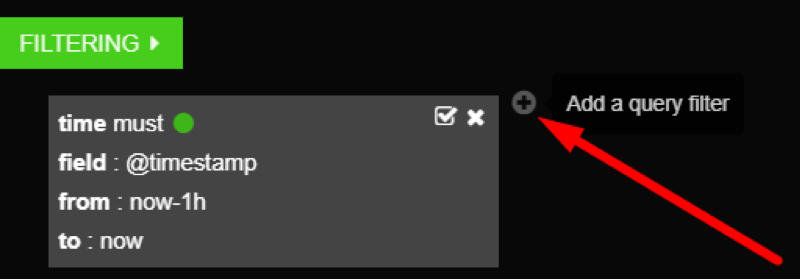
Adding filters

Querysting
Querysting filter can only be added manually. It is simply a query, and it follows the same rules as standard Query.

Field/Value
Field/Value filter is added by clicking on a value presented in one of the graphs.
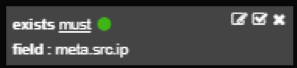
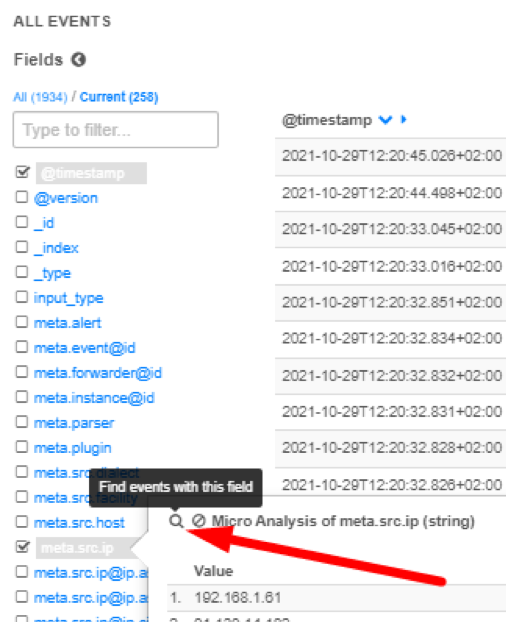
Exist filter
Exist filter is added by clicking the magnifying glass icon next to a field name in Table graph. This filter means that given field must exist inside a log to be shown on a graph.
All Events Field
If you add a series of filters, they will have an AND union between them.
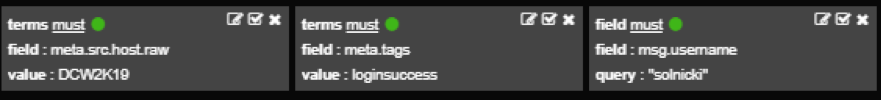
Series of filters
Which means each log presented on a dashboard must meet all filter conditions. It is a great way to “drill-down” into your logs and going from broad to narrow view.
You can change union between filters by clicking on “terms”.
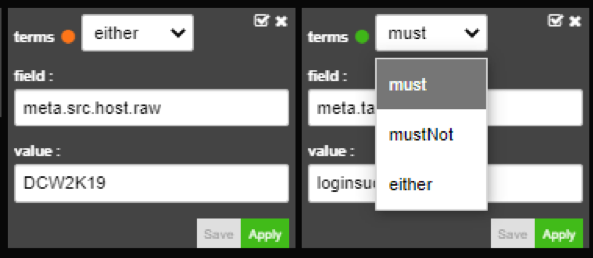
Changing union
This way you can make filters follow an OR union.
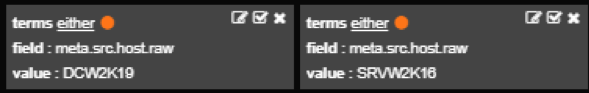
Making filters follow
In this example logs must match either first or second filter, so meta.src.host.raw must have value DCW2K19 OR SRVW2K16.
You can also select a NOT logic.

Making NOT logic filters
In this example, logs cannot match either of the filters, meaning only logs where meta.src.host.raw does NOT contain the value DCW2K19 OR SRVW2K16.
Dashboards are organized into a system of rows and panels. These can be added, removed and rearranged to suite your needs.
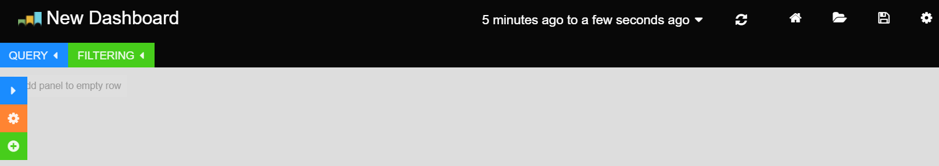
Your new blank dashboard will appear with the query and filter sections expanded, a time filter input in the navigation bar at the top, and not a whole lot else. Click the Add a row button on the right to add your first row.
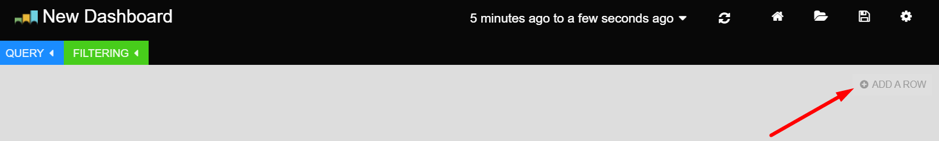
Adding a row
Give your row a title and click Create Row. You will see your new row appear in the list of rows to the left. Click Save.
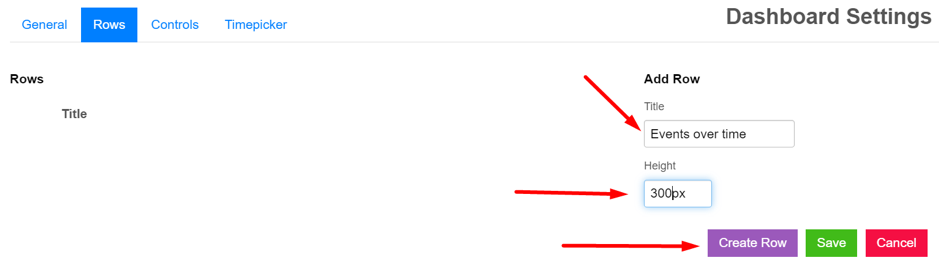
Create row
Now that you have a row, you will notice a few new elements on your dashboard.
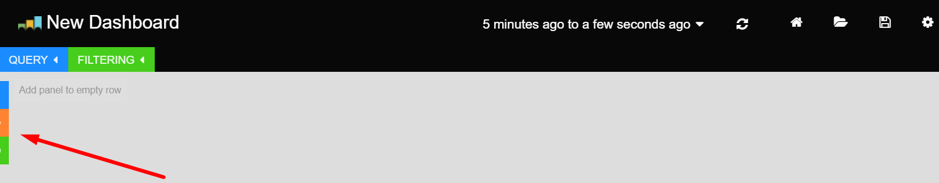
Row controls
Chiefly, the 3 brightly colored rectangles to the left. Move the mouse over them:
Row buttons
These buttons allow you to accomplish 3 things:
- Collapsing rows (blue)
- Configuring rows (orange)
- Adding panels (green)
To add a panel click the green “plus” button.
Add panel
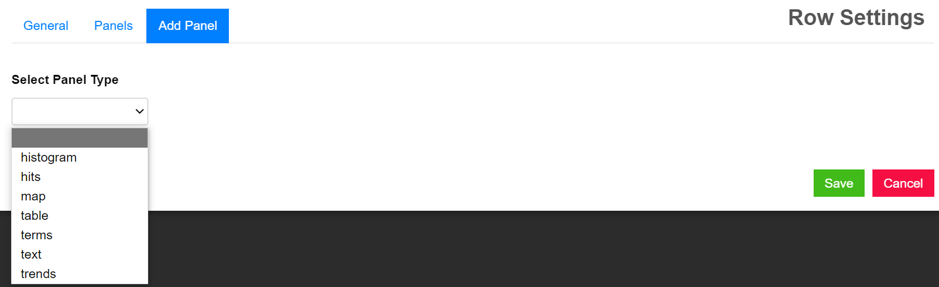
From here, you can select different types of panels (graphs). Selecting one of them (for example the terms panel) will take you to this graph configuration menu.
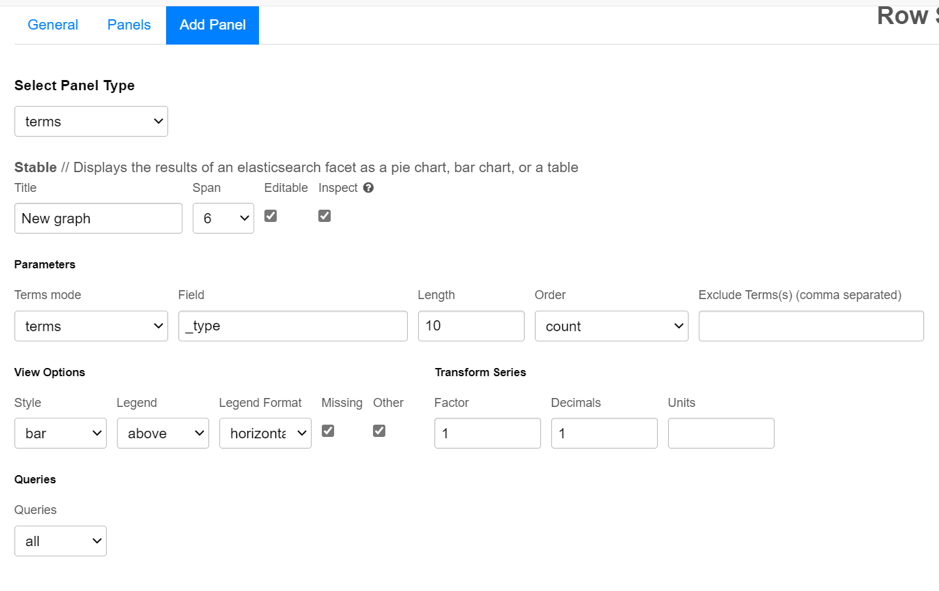
Add terms panel
Configuring a graph and saving it will generate it in previously selected row.
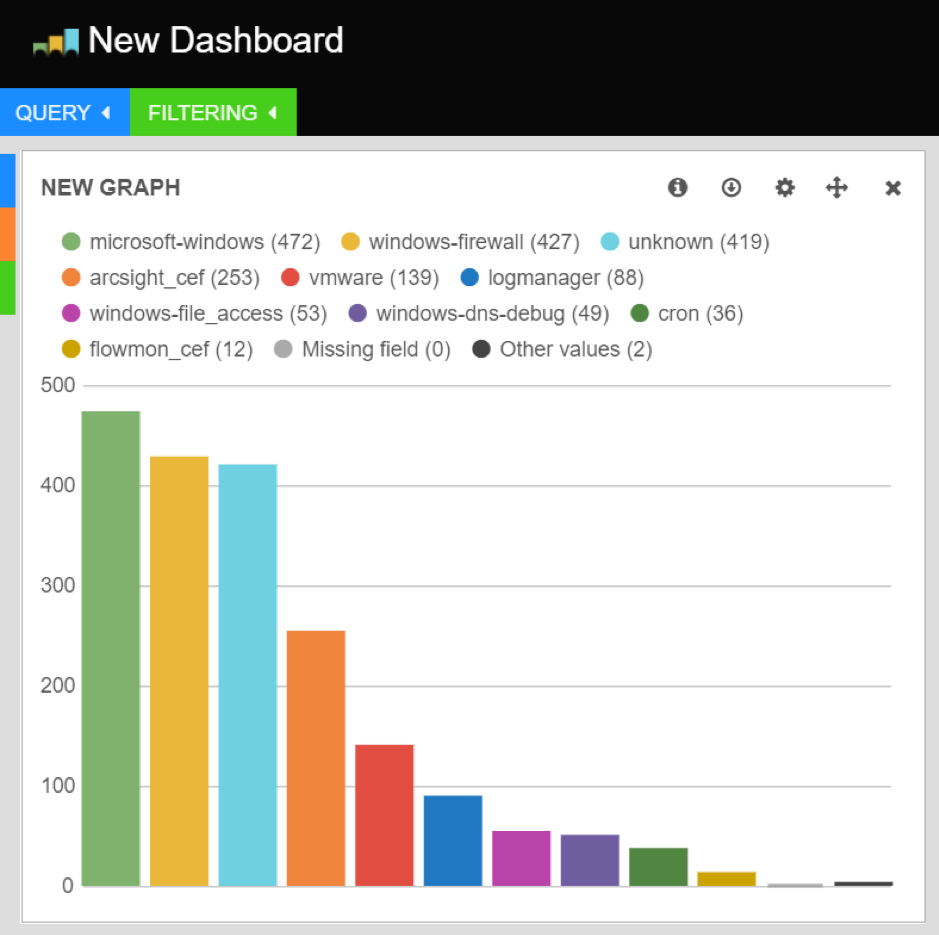
New panel
The blue button collapses your rows.
Collapsing row
Panels in collapsed rows do not refresh data. Collapsed rows are great for data that you don’t need to see often. Click the blue button again to expand the row.
Collapsed row
The query and filter sections at the top can also be collapsed. Click the colored label to collapse and expand.
Rows can be renamed, resized and edited via the row editor. Click the orange gear icon button to open the row editor.
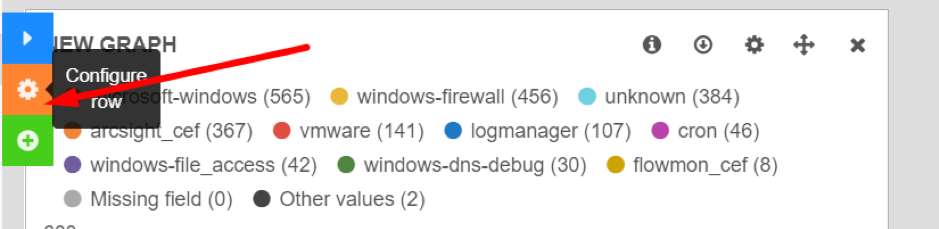
Row edit
The same dialog also allows you to change the order and size of panels, as well as remove them.
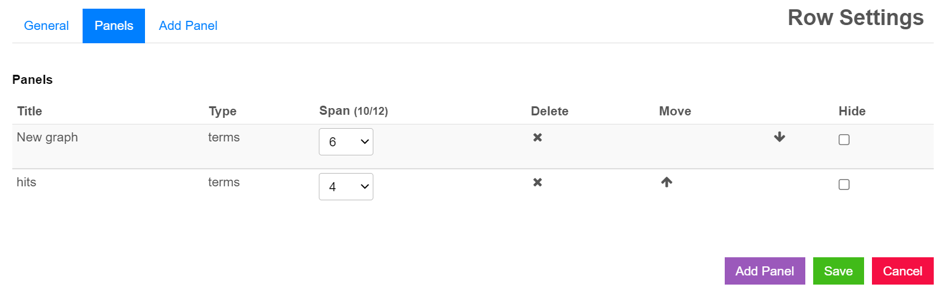
Removing Panels
Panels can be dragged and dropped within their own row or into another row by dragging the crosshair-shaped move icon in the top right of the panel.
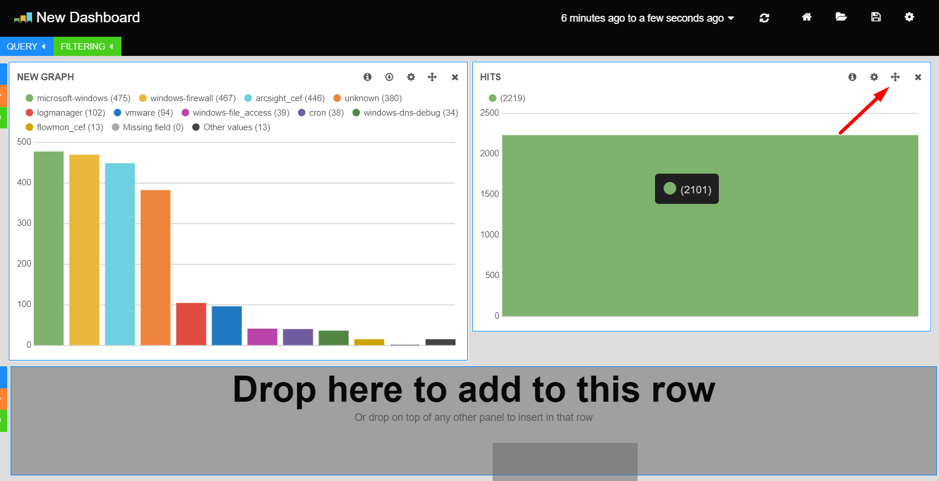
Moving and Removing Panels
Click the remove icon in the top right of a panel to remove it from the dashboard. Panels can also be removed from the row editor.
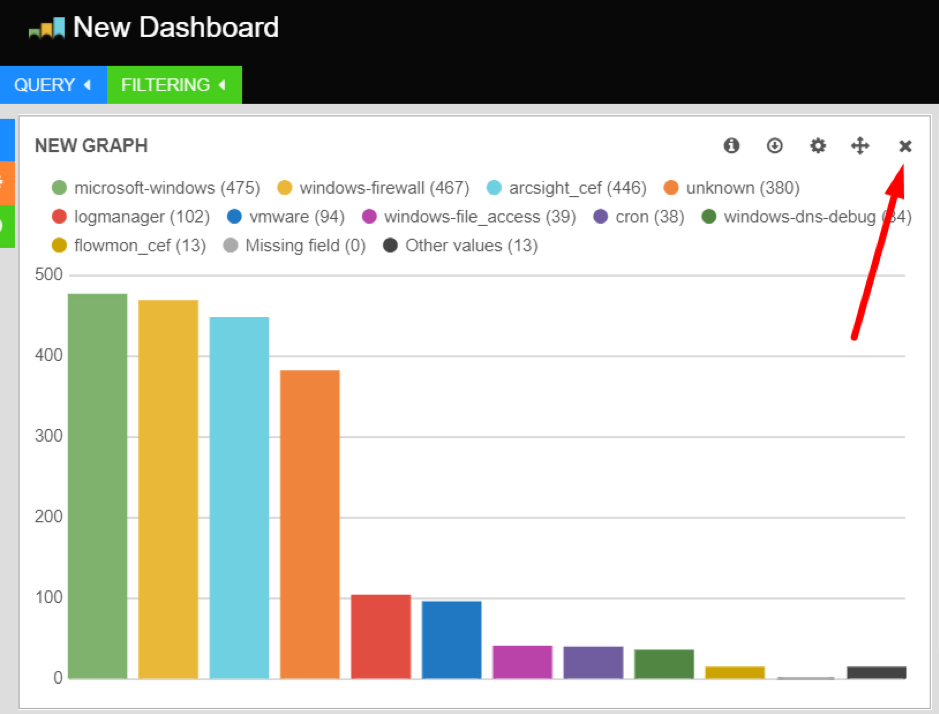
Moving and Removing Panels
Rows can be re-ordered and removed via the dashboard configuration screen. Click the gear icon in the top left of the screen, and select the Rows tab to make changes to the row layout. You may remember this screen from when we added our first row.
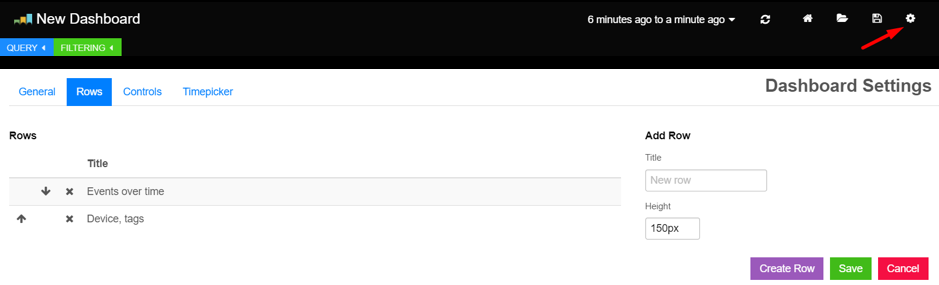
Removing Rows
The arrows to the left allow you to change the order of the rows on your dashboard. The X is used to remove rows.
Dashboard can persist settings via save option and allow you to recall them via the load option.
Saving your flashy new interface is as easy as opening the save drop down by clicking the Save icon in the upper right-hand corner. Give your new dashboard a name and hit enter. Now your dashboard has been saved.

Saving your dashboard
To search a list of your saved dashboards, click the Load icon in the upper right-hand corner. From here, you can load and remove dashboards.
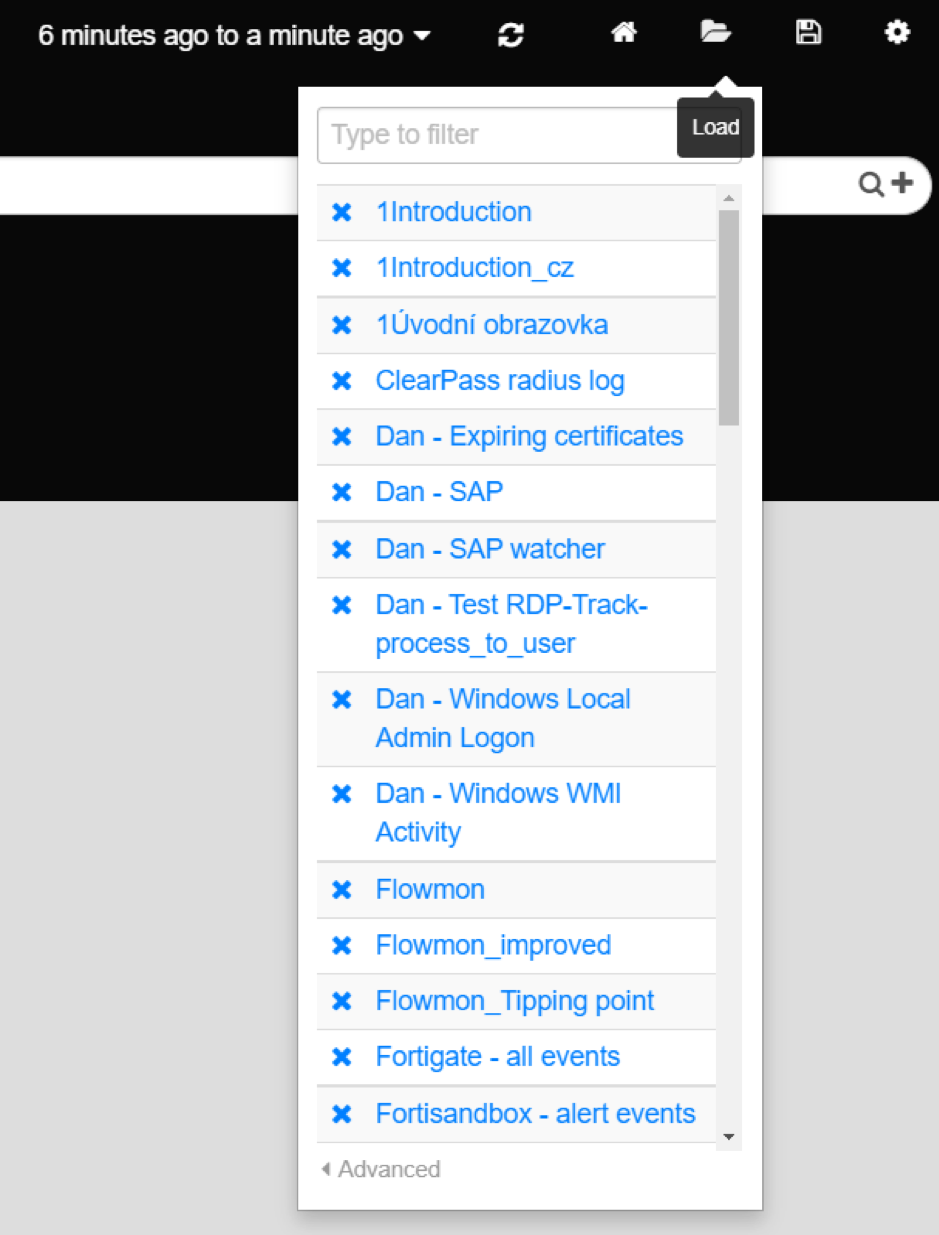
Recalling your dashboard
Panels with the icon Export allows you to save the displayed values in CSV format.
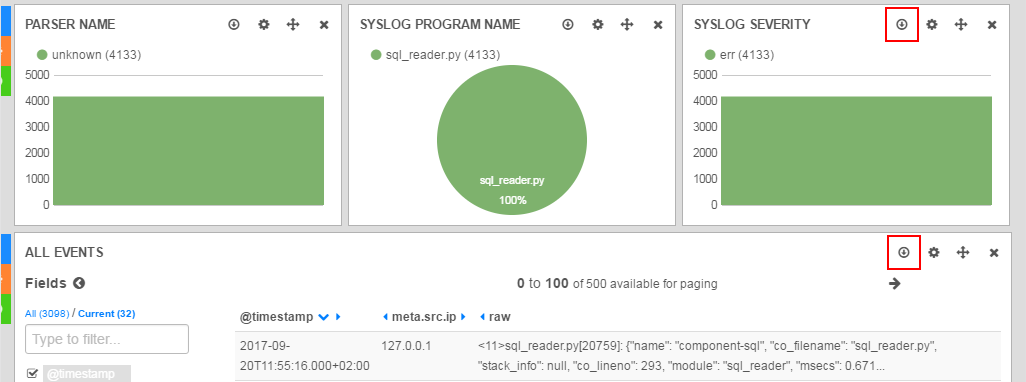
Data export
To export the data, proceed as follows:
- In the selected panel, click on the export icon,
- A new window will appear, informing you about the preparation of the data for export,
- This window must be opened during all the time of export preparation,
- After the preparation is complete, a download window is shown.

Preparing data for export
Format of exported data:
- File is in GZ archive format.
- Archive contains a CSV file with exported data.
- Data is stored in UTF-8 encoding.
When exporting with Safari, you must change a few browser settings to download the file content correctly.
Follow these steps:
- Go to: Safari > Preferences > Privacy
- Disable “Block all cookies” and “Prevent cross-site tracking” checkbox
- Go to: Safari > Preferences > General
- Disable “Open ‘safe’ files after downloading” checkbox
Now the browser should download desired exported file correctly.
When importing a CSV file into Microsoft Excel, choose UTF-8 encoding.
Exported files will be deleted from Logmanager automatically when downloaded. If the user does not download exported files, they are automatically deleted 12 hours after the export is completed.
In the case of long-lasting exports, you can copy the export URL of the newly opened window and open it again in a few hours (for example, the next day). Once the URL is reopened, you can check the current status of the export without interrupting the export.
System has limited number of concurrent export tasks. Database backups (Backup/Restore)) share task limits with user exports, this can cause long waiting times for user exports when database backup job is running.