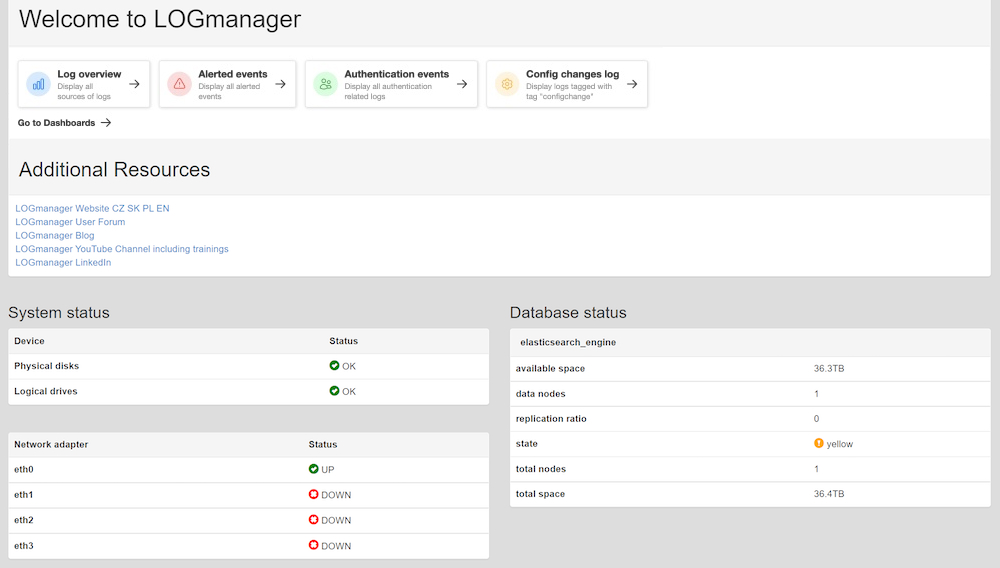
Overview
Overview menu is a default page of Logmanager platform. It is used to display overall state of Logmanager platform as well as some additional information. This page contains:
-
Introduction - any important messages regarding upcoming releases will be displayed here (such as system component becoming deprecated).
-
Additional resources - links to important pages containing Logmanager knowledge.
-
System Status:
- Status of the disk subsystem - physical and logical disks. Status can be either “OK” (if everything is fine), “KO” (if there is an issue), or “NA” (in case the information could not be retrieved).
- Status of the connected network interfaces. Status can be either “UP” (if the interface is up), “DOWN” (if the interface is down), or “NA” (in case the information could not be retrieved).
-
Database status: Logmanager elasticsearch database storage - total and available space, amount of nodes/replication ratio (in case of cluster) and overall state.
State can be presented in either green, yellow or red color.
The yellow state is the normal and does not indicate issues.
Overview
Data visible here is renewed every 10 seconds, so you can get a good overview of the current status of server components. If any error occurs, or a fault status remains for a longer period, please contact the technical support.