Database status
This page shows the overall condition of the Logmanager database. Here you will find information regarding:
- Database (Elasticsearch engine) status.
- Data indices state.
This part provides detailed information regarding the state of the Elasticsearch engine.
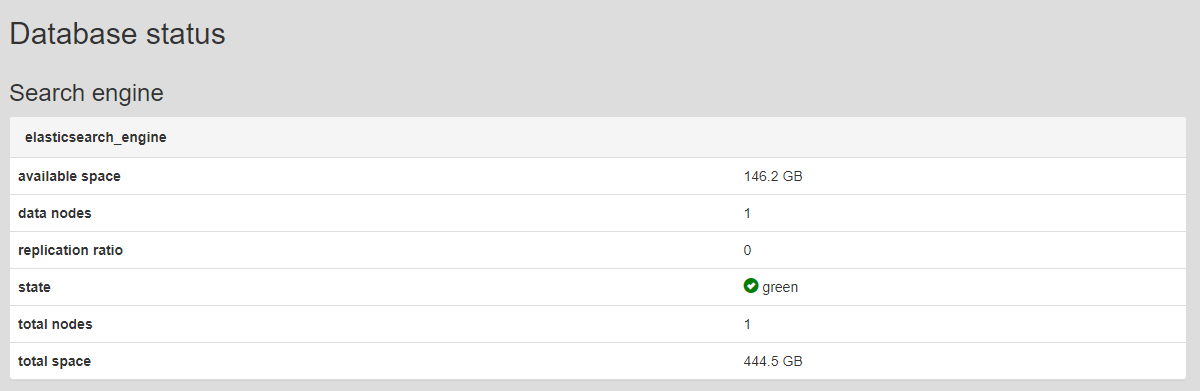
Search engine
- Available space- How much disk space is currently available for writing.
- Data nodes - The amount of Logmanager nodes working together.
- Replication ratio - This number displays the state of database replication when Logmanager operates in cluster mode. The values range between 0 and 1 (0 - no replication, 1 - one data replica). The normal state is 1, but after a Logmanager restart or when adding a new node to the cluster, this number is usually around 0.74545. It only represents the status of open indexes, not closed ones.
- Status:
- Red: Red status occurs when the database is in service mode, performing maintenance tasks or integrity checks. This state occurs after the Logmanager system restarts or following a software update. Service mode can last several hours, depending on the amount of stored data. Messages received by Logmanager during this period are saved in the internal memory and will be available once service mode is complete.
- Yellow: Yellow status occurs if Logmanager is not running in the cluster mode. The database does not have a replica of the stored data, because there is no other server, which could create a replica. In standalone Logmanager server deployment, the yellow status is normal operational state.
- The red and yellow states may also occur for a few hours even when the old indexes are opened.
- Green: This is the normal state of the database, if Logmanager is running in the cluster mode.
- total nodes - The amount of nodes in a cluster.
- total space - Total disk space connected to the database.
If the red status does not change even after a few hours, please contact technical support.
This part provides detailed information regarding the state of each Indice available in the system.
Logs in the Logmanager system are grouped in the database using so called Indices. Each Indice (index) contains logs collected from 00:00 to 23:59 each day since starting the system.
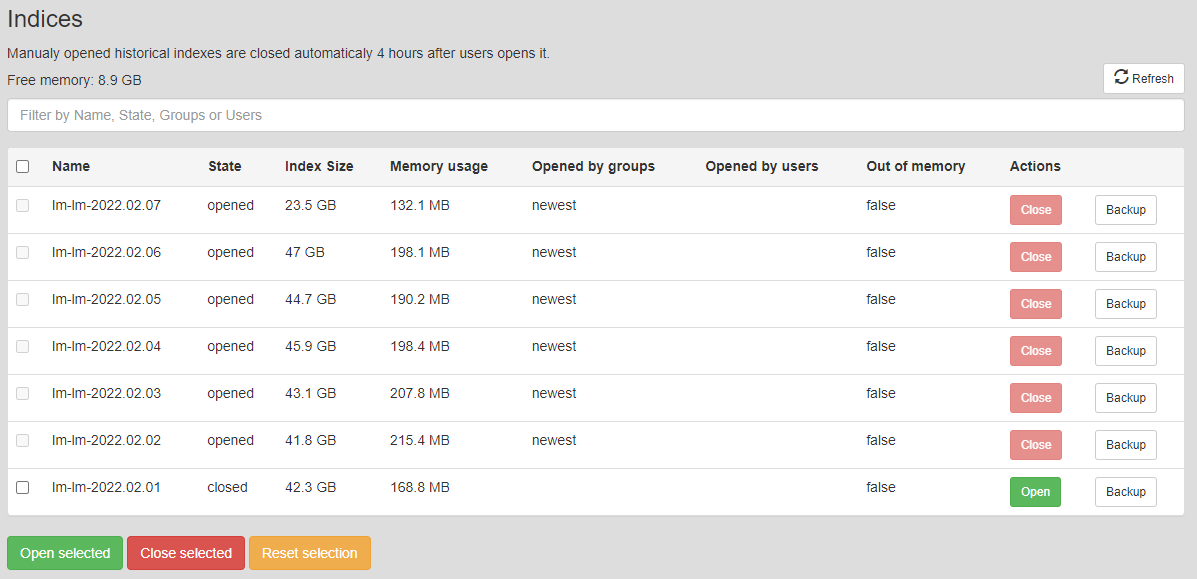
Here you can see available indices, their state, size, memory usage, and action buttons (open/close, backup) for each.
Index
Each Indice is described using following parameters:
- Name: Indice name. Date visible in the name refers to exact day for which given Indice contains logs.
- State: Indice can be either Opened or Closed.
- Index size: Total size of the Indice. This information can provide a good overview of how much data you are collecting daily.
- Memory usage: How much space Indice occupies in operation memory (RAM) if it is opened.
- Opened by groups: Which user groups requested an Indice to be opened (user/system).
- Opened by users: List of users which requested an Indice to open.
- Out of memory: Default status is false. In case of insufficient operation memory (RAM), it will temporarily appear as true at the time new index is open.
- Actions: you can manually open or close Indices using these buttons.
Closing index: You can close the Indice only if there is no group or user who is currently using it. For example: If the Demo user opens the Indice, the “Opened by groups” will show “users” and “Opened by users” will show “Demo”. The only user who can now close the index is the Demo user.
Automatic Index Closing. If the user forgets to close the Indice, it will remain open for 4 hours and then close automatically.
Indices must be loaded to RAM (Opened) to be able to search through them. Logmanager does this automatically depending on selected search period in dashboard. Several newest Indices are always Opened (Usually 6, but this number can change).
Manual Index Opening. In most cases, you do not need to open indexes manually, they are opened automatically based on searches in dashboards.
Users who have System Administrator privileges will see the Backup button next to Actions.
When a button is pressed, a process is performed in the background to back up the selected Indice to a remote SMB server. It is required that the SMB server is configured – otherwise this button will have no effect.
Please note that the backup has limits on concurrent running task. The database backup temporary queues user export requests from dashboards. For more please see Data export.
Data backup takes a long time, so it’s not recommended to run a backup on all Indices at the same time.