Alerts
System Logmanager provides a special adjustable function for sending reports on the occurrence of defined events. You can define the various areas of alerts, as for example, the incidence of the wrong user logging in to the monitored device, alerts about the occurrence of the failed disk in the client workstation, or about the saving of the new configuration to the device.
Alerts settings use a visual designer, the whole process is very quick and transparent. Alert is delivered to the specified email address, and you can set up the format and unify the appearance of emails, for example, for corporate needs.
For proper function, the device must send logs to the Logmanager system.
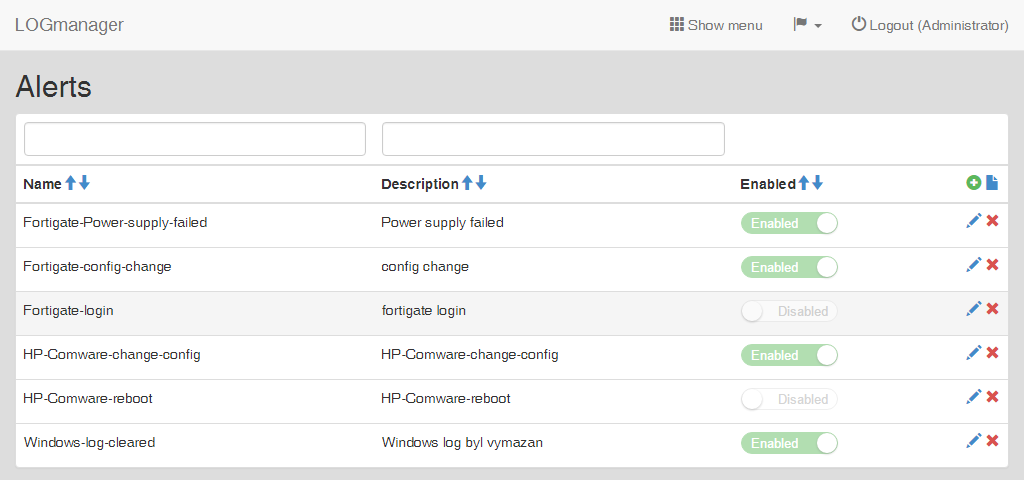
Menu Logs ‣ Alerts contains only basic information about the alerts:
- Name: Name of the alerts,
- Description: Description of the alerts,
- Enabled: Whether the alert is active.
You can create, create from template, edit, or delete.

Alerts
The Logmanager system automatically processes all enabled alerts in alphabetical order. Even if messages were alerted in the first alert, they are always processed in all other configured alerts.
More about Classifiers
Process of creating the notification is divided in following steps:
- Searching for data in the Dashboards section,
- Creating email template,
- Creating new alert.
New alert from the template can be created by clicking on the new from template to simplify the procedure.
-
Clicking on the plus icon opens a form, where you can create a new alert.
-
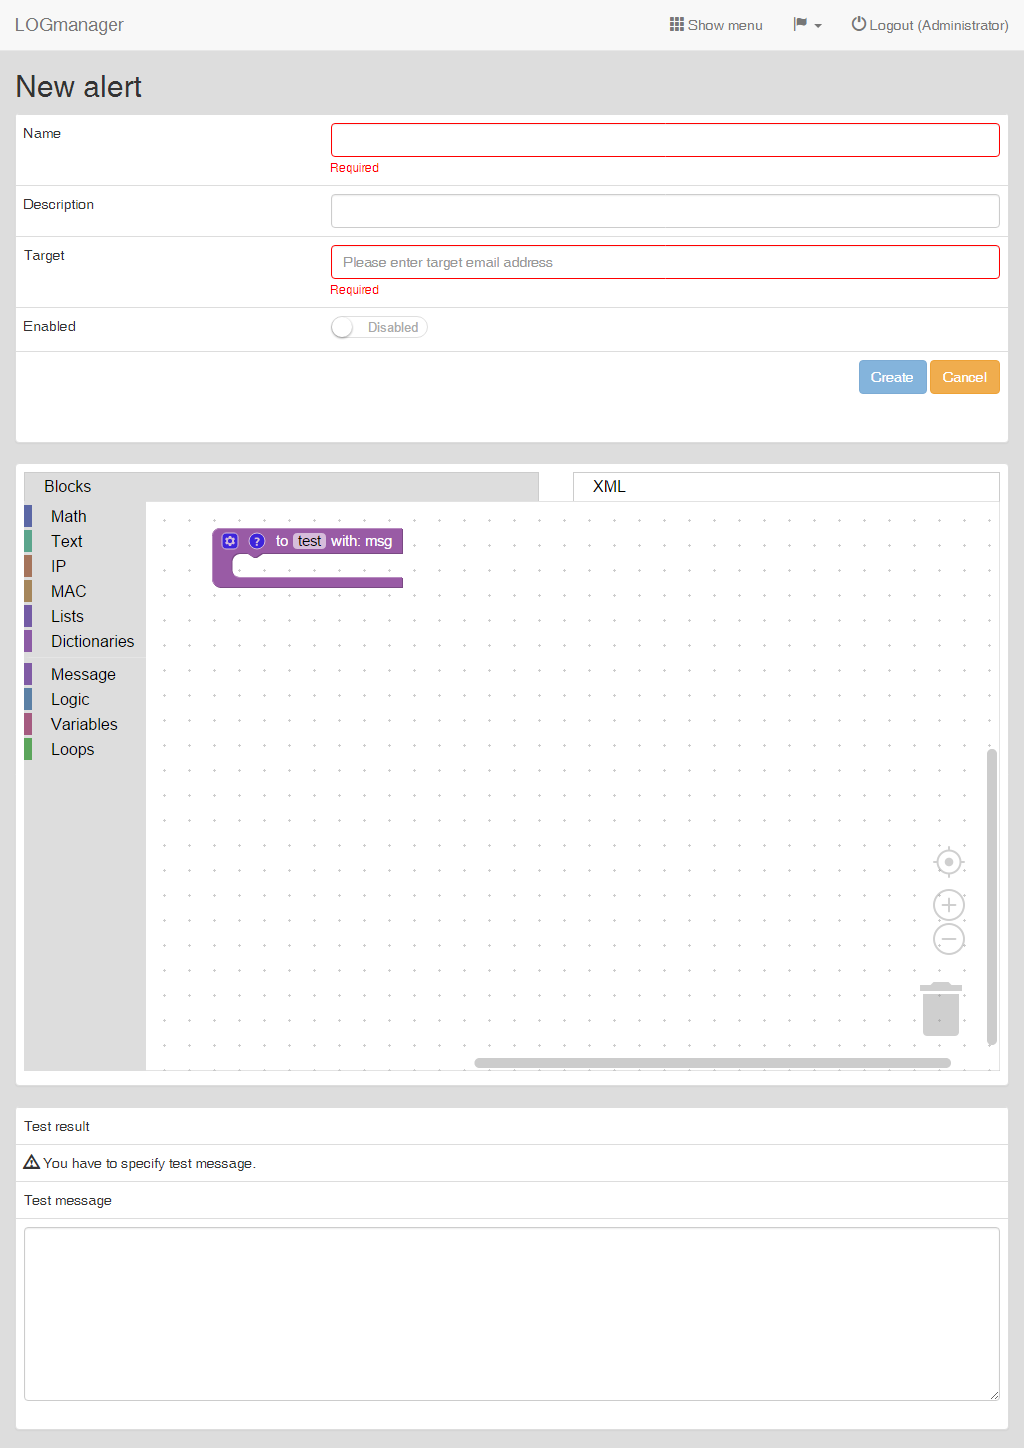
Enter the following:
- Name: Name of the alert.
- Description: Short description of the alert.
- Target: The email address where the alert will be sent. It is possible to enter multiple email addresses separated by a space.
- Enabled: Status of whether an alert is enabled or disabled.

Create a new alert
-
The next step is a visual designer window where you can visually define the alert criteria.
Conditions are completed based on the knowledge of a specific message, which should trigger the notification.
Working with the visual designer is described in chapter Events processing in blockly.
-
Sending of the notification is defined with the block Send alert. Email template is also set in this block.
-
Message which was used for definition of conditions is inserted to the Test message field Example of saved message.
-
In field Test result is shown the result of the test.
-
Click on the button Create to save the alert. Click Cancel to cancel the all the modifications made.
You can get a test message in: Logs ‣ Dashboards ‣ and then open any dashboard and find the message received in Logmanager that you want to test. The message must be copied in JSON format, which can be found in the event overview.
Example how to get a test message:
Open Logs ‣ Dashboards ‣ and click on Log overview. At the bottom you will find the All Events table, in which you click on the event of your choice. In its description, you will find a View button in the upper left corner, which switches the display of formats. Switch to JSON format and copy the entire message to the test window.
Please read carefully!
The context test window uses the same shared memory as the messages that are processed by the system. The same rules are applied to test messages as for regular messages. Inserting a test message creates a new context or uses an existing context. The test window affects the contents of contexts just like data that passes through the system normally.
In other words, if you want to test a context after you have verified the functionality in a test window alert, you need to either wait for the context to expire or change its ID to create a new context.
The alert sending mechanism is designed so that in the edge situations (when a given alert hits a large number of events and sends an alert), the alert recipient's email account is not overwhelmed. Therefore, in the case of generating multiple alerts, Logmanager aggregates the emails being sent to avoid overwhelm.
If identical alerts are generated on Logmanager, they are aggregated. Logmanager sends the first 9 messages of the same alert, then aggregates the messages for 60 seconds from the next 9th message, and after another 60 seconds writes a message that ends as follows: Dropped similar messages: xxx.
Then sends 9 messages and then aggregates again for 60 seconds.
Each event for which an alert has been triggered is marked with the notified tag. Thus, not a single alert is lost. If you want to see all events within Logmanager for which an alert has been triggered, go to Logs ‣ Dashboards ‣ Alerted events.