Rules
System Logmanager provides adjustable functions for sending reports on specific events. You can define various alert areas, such as unauthorized user logins, disk failures on workstations, or configuration changes on network devices.
The alert settings utilize a visual designer for a quick and transparent setup process. Alerts are delivered to specified email addresses with customizable formatting to match corporate standards.
For proper function, the device must send logs to the Logmanager system.
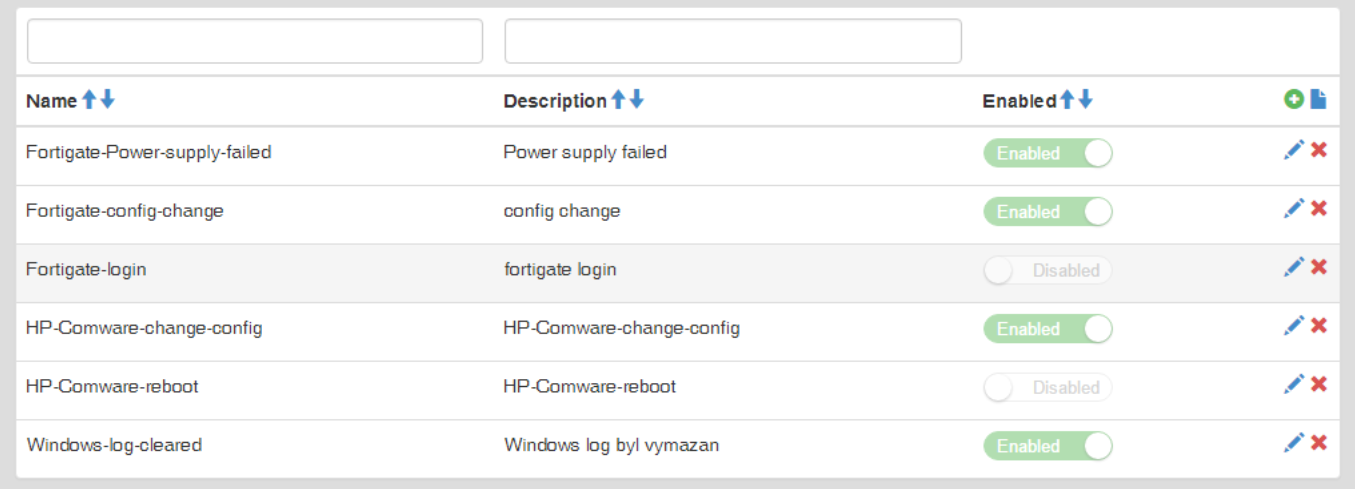
The menu displays basic information about configured alerts:
- Name: Name of the alert.
- Description: Short description of the alert’s purpose.
- Enabled: Indicates whether the alert is currently active.
You can create new alerts, create from templates, edit, or delete existing rules.
Alerts
Logmanager processes all enabled alerts in alphabetical order. Even if a message triggers an initial alert, it continues to be processed by all other configured alert rules.
For more details, see the Classification section.
The process of creating a notification consists of the following steps:
- Finding sample data in Dashboards.
- Creating an email template.
- Defining the alert rule.
To simplify the procedure, you can use the New from template button to create a pre-configured alert.
- Click the Plus icon to open the alert creation form.
- Enter the following details:
- Name: Unique name for the alert.
- Description: A brief explanation of the alert.
- Target: The recipient email addresses (separate multiple addresses with a space).
- Enabled: Toggle the active status of the alert.
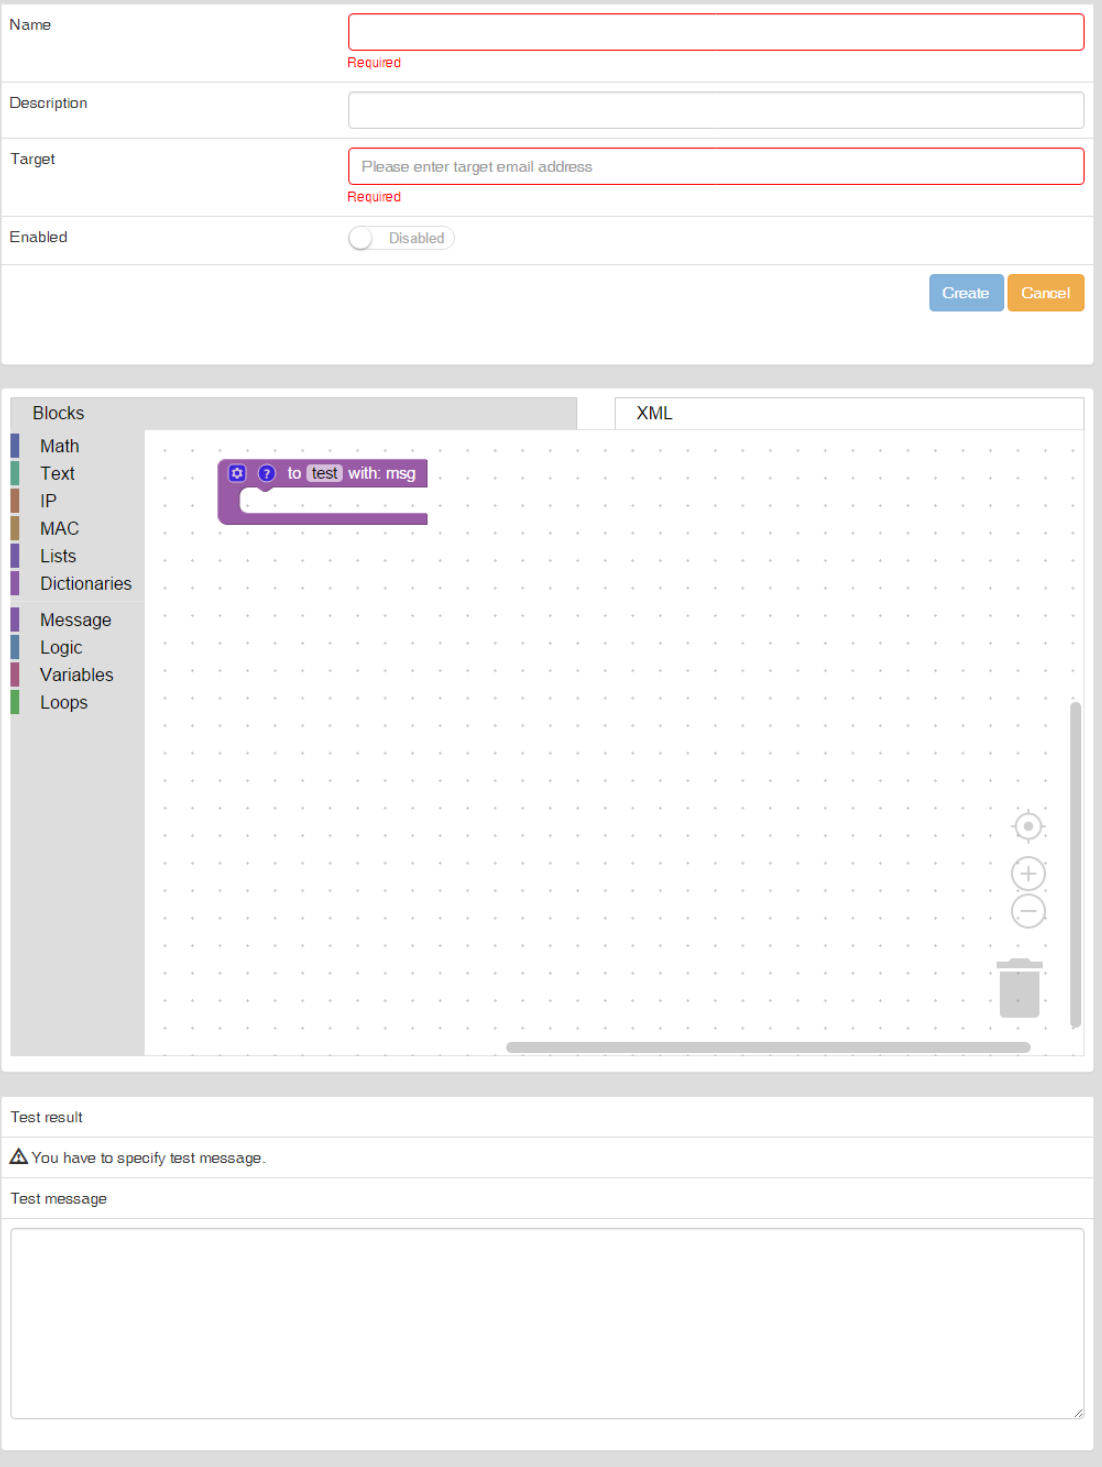
Create a new alert
- Use the Visual Designer window to define your alert criteria using blocks. Working with this interface is described in Events processing in blockly.
- Define the notification delivery using the Send alert block, where you will also select your email template.
- Insert a sample log into the Test message field to verify your conditions.
- Review the results in the Test result field.
- Click Create to save or Cancel to discard changes.
To obtain a valid test message, navigate to Analysis ‣ Dashboards and open the Log overview. Locate the desired event in the All Events table, click it, and use the View button in the upper left corner to switch to JSON format. Copy the entire message into the alert test window.
The test window shares memory with the live system. Inserting a test message affects contexts (shared memory) just like real data. If you test an alert, you may need to wait for the context to expire or change the ID before testing again to ensure a clean state.
To prevent overwhelming recipient email accounts during high-volume events, Logmanager uses an aggregation mechanism:
- Initial Burst: The system sends the first 9 messages of an identical alert immediately.
- Aggregation: From the 10th message onward, messages are suppressed for 60 seconds.
- Summary: After the 60-second window, a summary is sent including the text:
Dropped similar messages: xxx. - Cycle: The process repeats (9 messages sent, followed by another 60-second aggregation period).
Every event that triggers an alert is marked with the notified tag. You can view all such events by navigating to Alerted events Dashboard.