Database status
The Database status page provides a real-time overview of the Logmanager database, including storage utilization, search engine health, and detailed index information.
To access this page, in the Logmanager web interface, go to Settings > System > Database status.
The Storage section displays the physical disk usage of the database. Units are automatically adjusted (e.g., kB, MB, GB, TB) for optimal readability.
- Occupied disk space: The amount of space currently used by the database, shown in bytes and as a percentage of total space.
- Available disk space: The remaining free space on the disk.
- Total disk space: The total capacity of the storage volume allocated to the database.
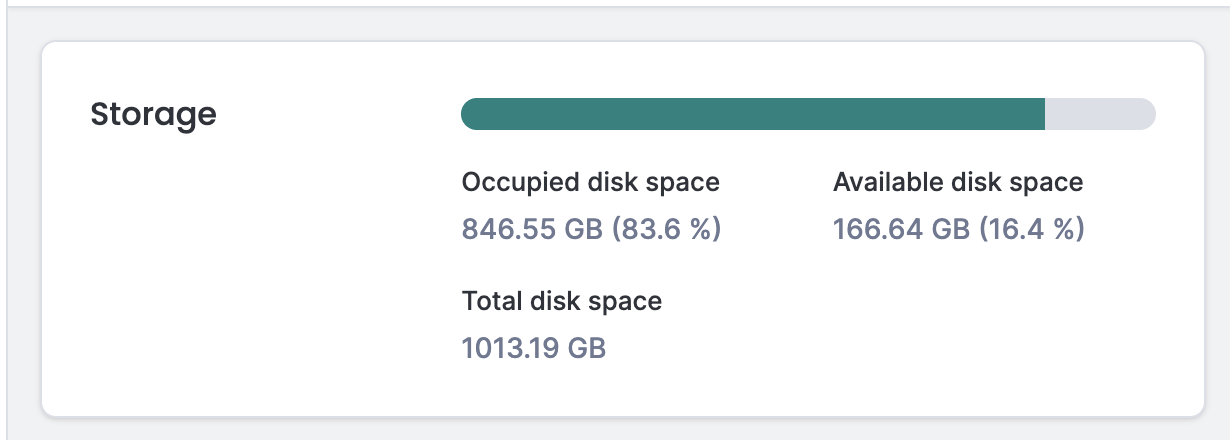
Storage
The Search engine section provides information about the state of the underlying search service.
- Database health: Indicates the operational state of the database (Green, Yellow, or Red).
- Red: Red status occurs when the database is in service mode, performing maintenance tasks or integrity checks. This state occurs after the Logmanager system restarts or following a software update. Service mode can last several hours, depending on the amount of stored data. Messages received by Logmanager during this period are saved in the internal memory and will be available once service mode is complete.
- Yellow: Yellow status occurs if Logmanager is not running in the cluster mode. The database does not have a replica of the stored data, because there is no other server, which could create a replica. In standalone Logmanager server deployment, the yellow status is normal operational state.
- Green: This is the normal state of the database, if Logmanager is running in the cluster mode.
- Uptime: Shows how long the search engine has been running since its last restart.

Search engine
If the red status does not change even after a few hours, please contact technical support.
The Aliases table lists the various log categories (aliases) stored in the database and their resource consumption.
| Column | Description |
|---|---|
| Alias | The name of the index alias. |
| Document Count | The total number of individual log entries (documents) stored under this alias. |
| Size on Disk | The total physical disk space consumed by the primary and replica shards. Units scale automatically based on size (kB, MB, GB, TB). |
| Write Index | The name of the current active index that is receiving new data for this alias. |
| Write Index Policy | The Index State Management (ISM) policy applied to the alias (for example, hot_warm or audit_logs etc.). |
| Index Count | The number of underlying indices associated with the alias. |
- Search: Use the text boxes at the top of the Alias and Write Index columns to filter the list.
- Sort: Click the column headers (such as Document Count or Size on Disk) to sort the table in ascending or descending order.
- Pagination: Change the number of items displayed per page using the dropdown menu at the bottom right.
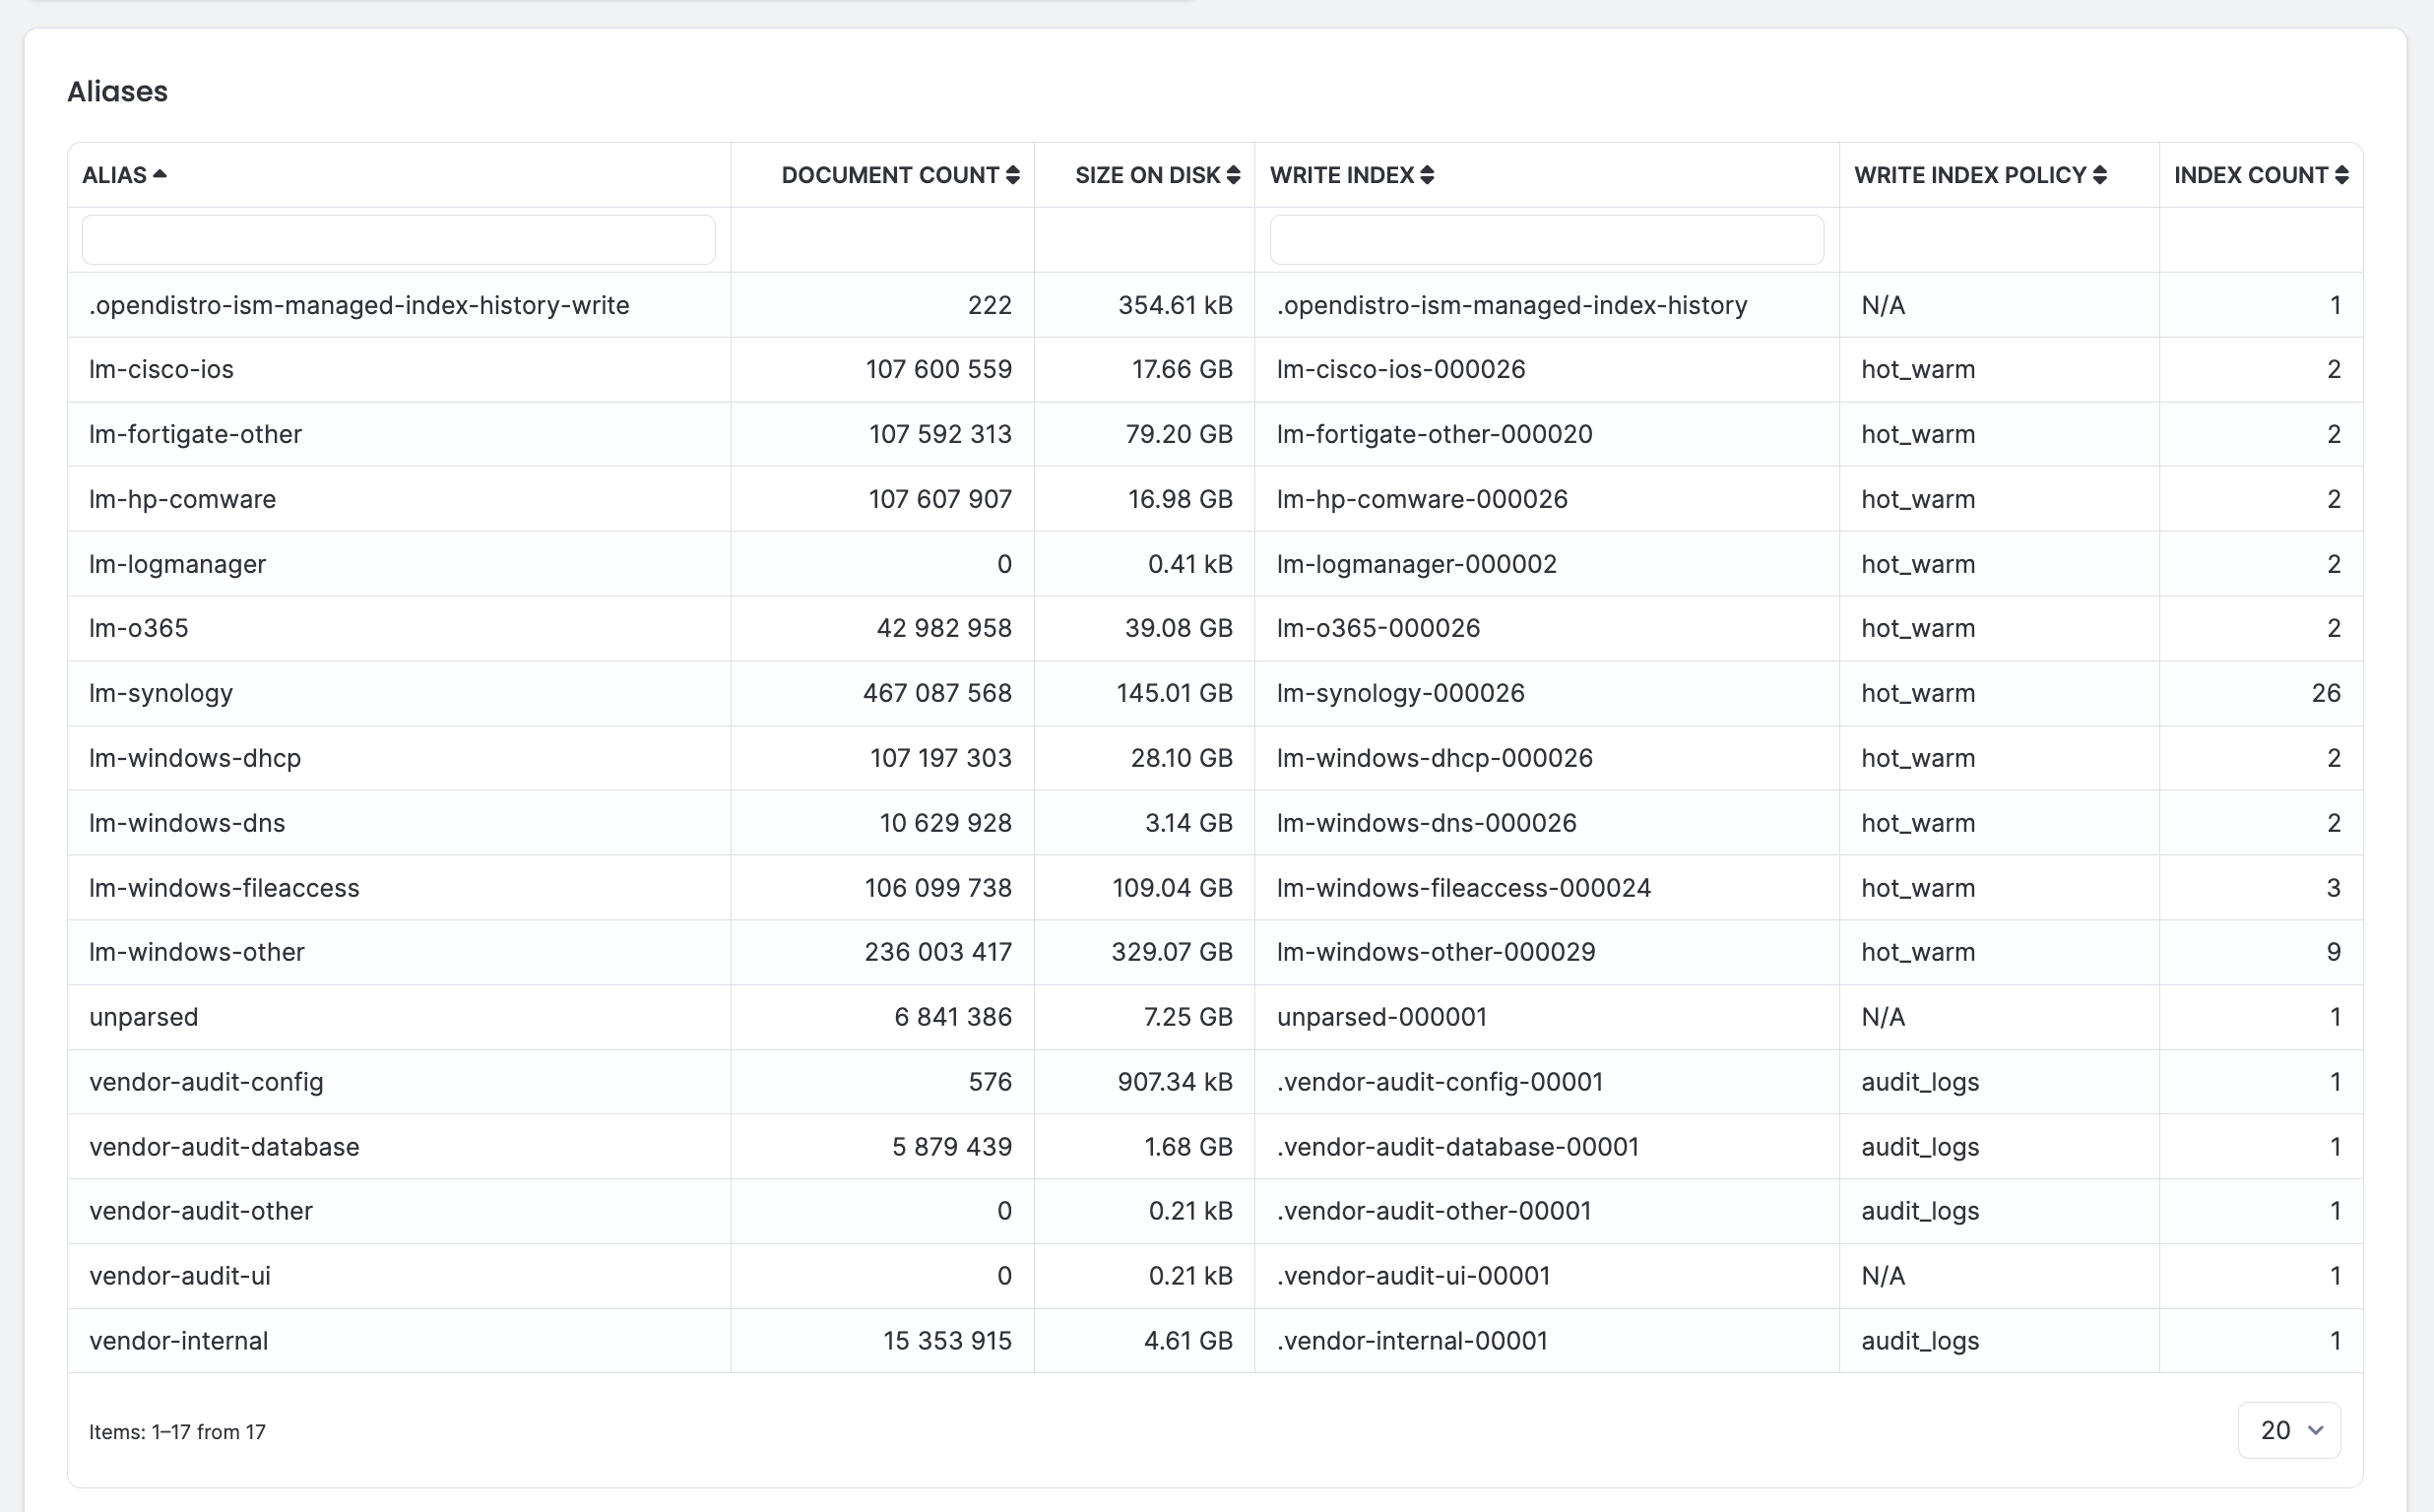
Aliases