System status
The System status page provides a comprehensive overview of the health, performance, and resource utilization of your Logmanager server.
To access this page, in the Logmanager web interface, go to Settings > System > System status.
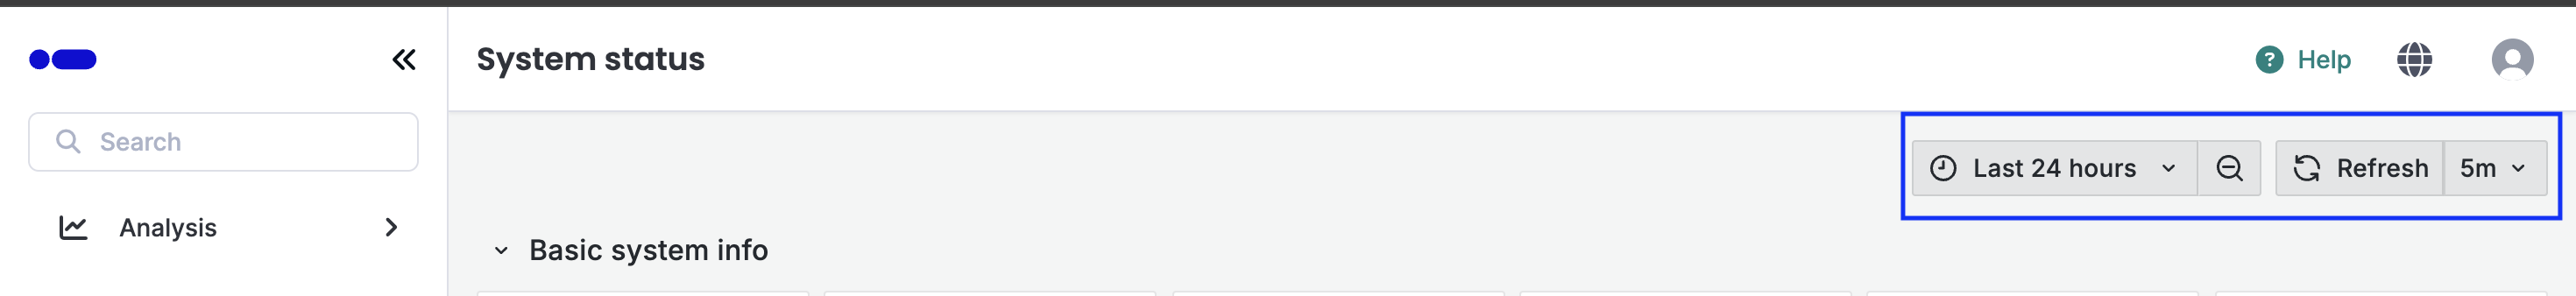
At the top right of the page, you can control the data displayed in the charts and metrics:
- Time range: Select the period for the displayed data (for example, Last 24 hours).
- Zoom out: Click the magnifying glass icon to expand the current time range.
- Refresh: Manually refresh the data on the dashboard.
- Auto-refresh: Select an interval (for example, 5m) to automatically update the dashboard data.
Global controls
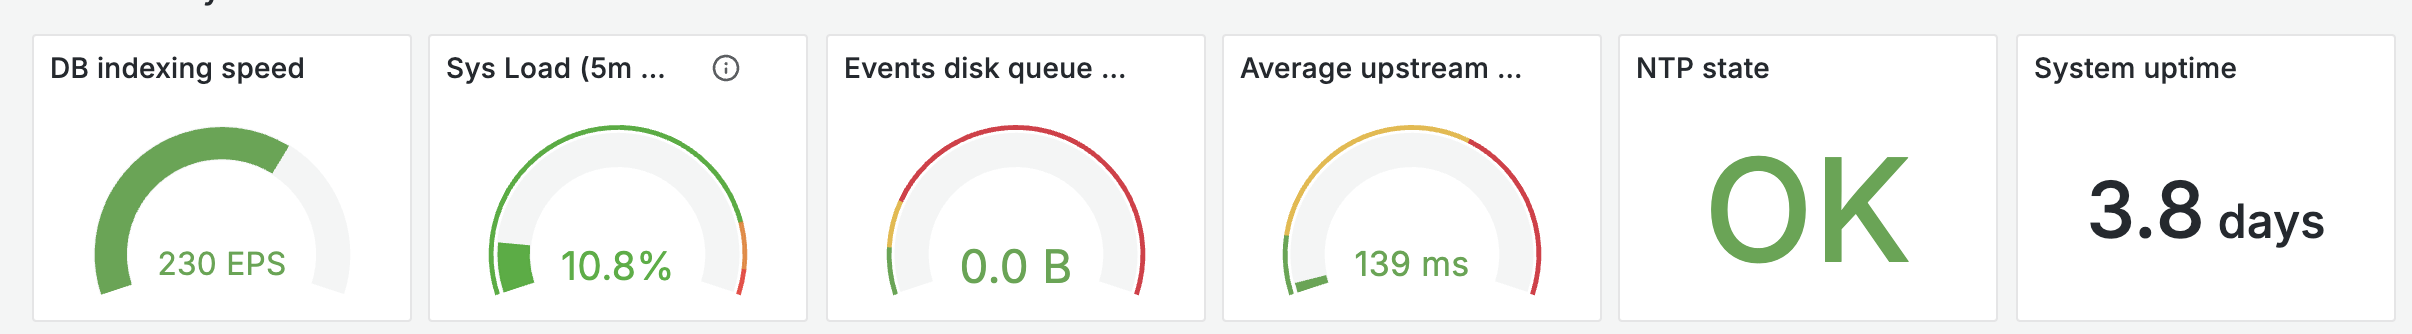
This section displays key performance indicators and high-level metrics for the Logmanager system.
- DB indexing speed: The current rate at which logs are being written to the database, measured in Events Per Second (EPS).
- Sys Load: The average system load, displayed as a percentage.
- Events disk queue size: The current size of the buffer storing events before they are indexed.
- Average upstream: The average response time from upstream DNS servers.
- NTP state: The synchronization status of the Network Time Protocol (for example, OK).
- System uptime: The duration the server has been running since the last restart.
Current metrics
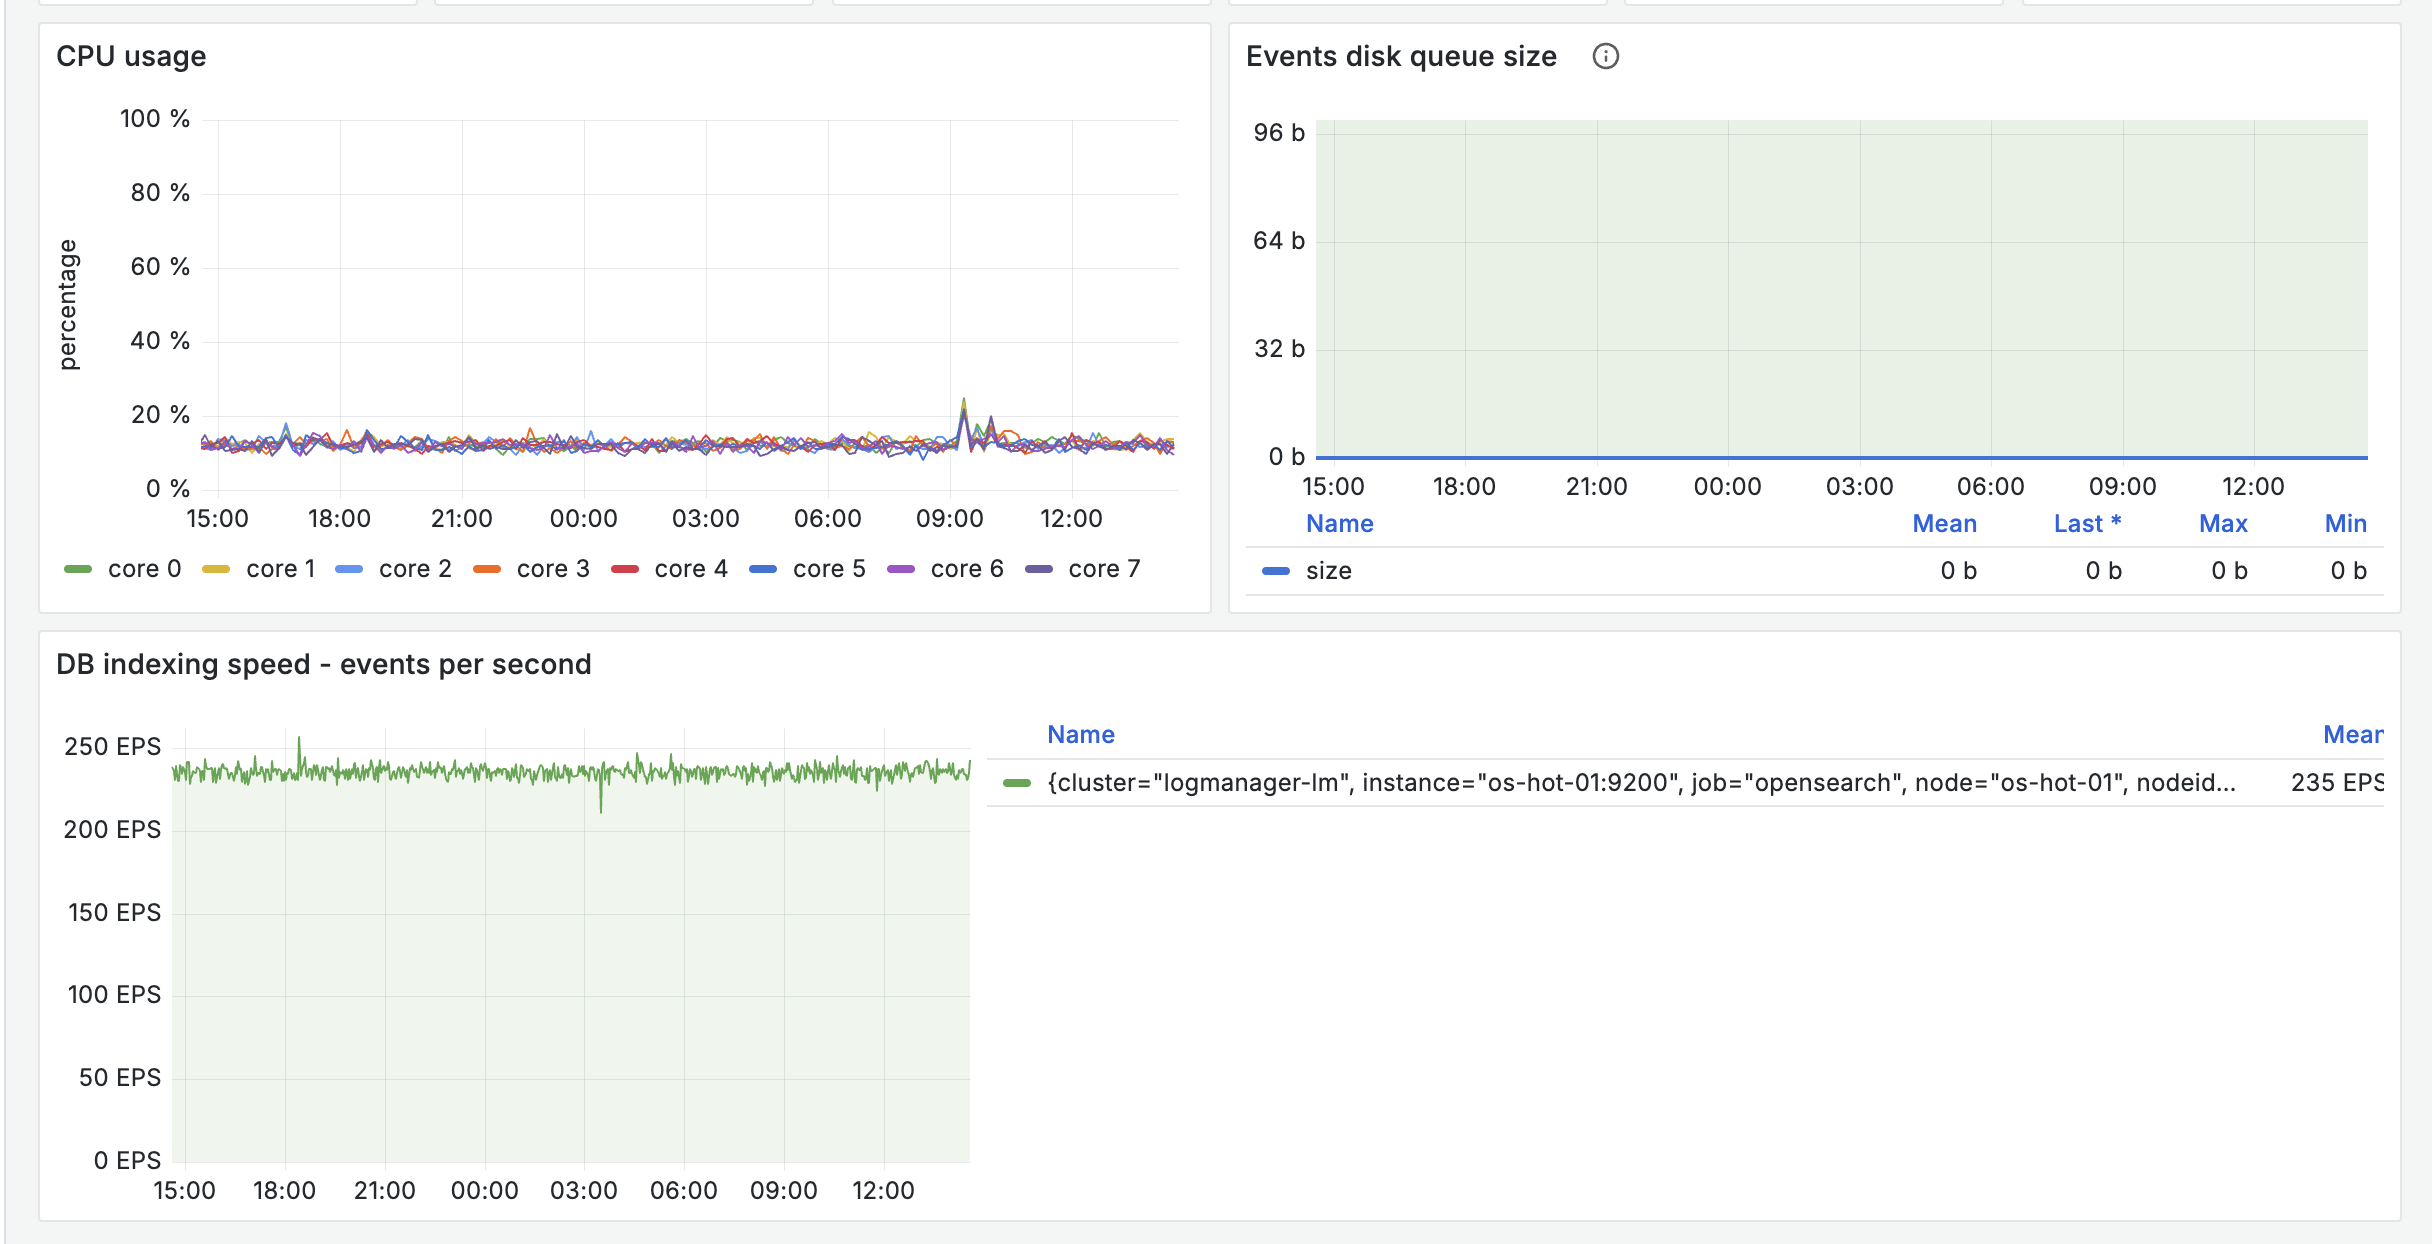
- CPU usage: Tracks the processing load across individual CPU cores over the selected time range.
- Events disk queue size: Visualizes the size of the event queue over time, helping identify potential ingestion bottlenecks.
- DB indexing speed - events per second: A historical view of the indexing rate over time.
Performance charts)
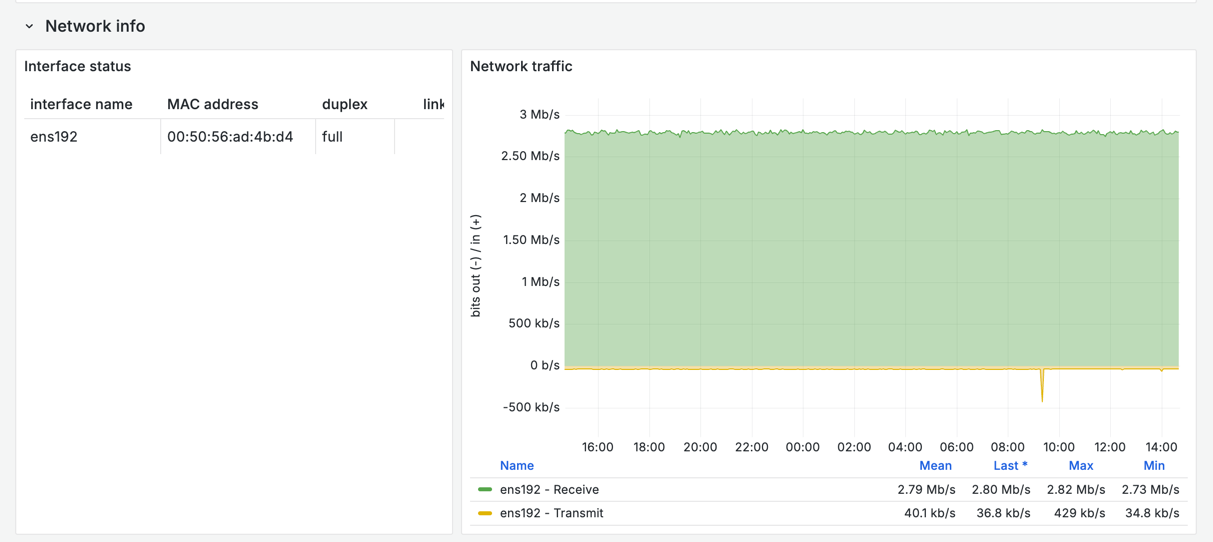
This section provides details about the network interfaces and traffic.
- Interface status: A table listing the physical network interfaces.
- Network traffic: A chart displaying the network bandwidth utilization over time, showing inbound (bits in) and outbound (bits out) traffic.
Network info
This section monitors the performance of DNS resolution, which is critical for system operations and log enrichment.
- Average upstream DNS response time: Tracks how quickly upstream DNS servers are responding to queries.
- DNS response codes: A breakdown of DNS query outcomes over time (for example,
NOERROR,NXDOMAIN,FORMERR), useful for identifying network or configuration issues.
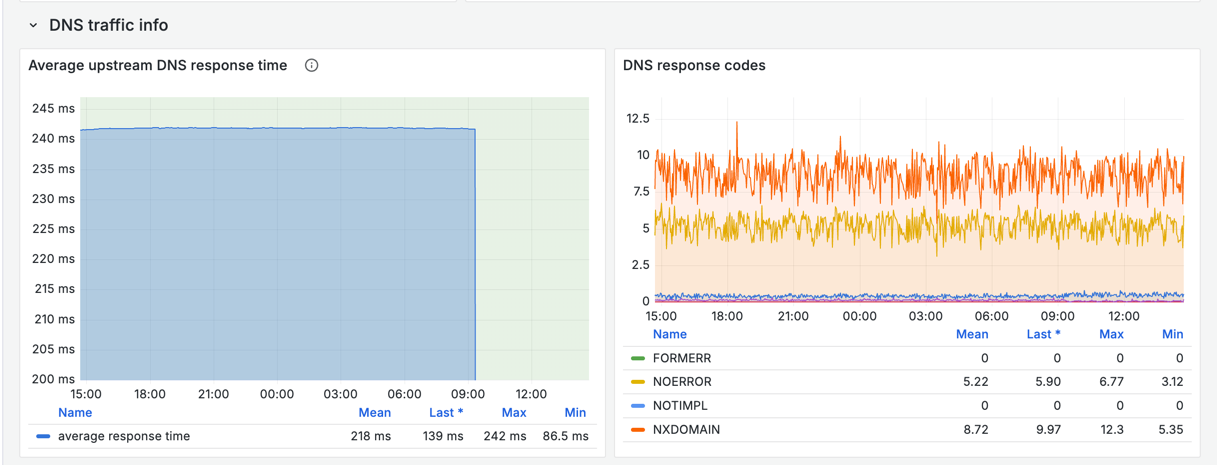
DNS traffic info
Requires compatible hardware.
This section displays Intelligent Platform Management Interface (IPMI) data, providing hardware-level monitoring.
- IPMI address information: Network configuration details for the IPMI interface.
- System temperatures: Thermal readings from various server components over time.
- Power consumption over time: Historical data on the electrical power usage of the server chassis.
This section tracks the performance and capacity of the server’s storage drives.
- Available disk space: A trendline showing the amount of free storage capacity over time.
- Disk Average Wait Time: Measures the average time (in milliseconds) required for read and write requests to be processed by the storage subsystem.
- Disk IOPs Completed: Tracks the number of Input/Output Operations Per Second for both read and write activities, indicating the overall storage workload.
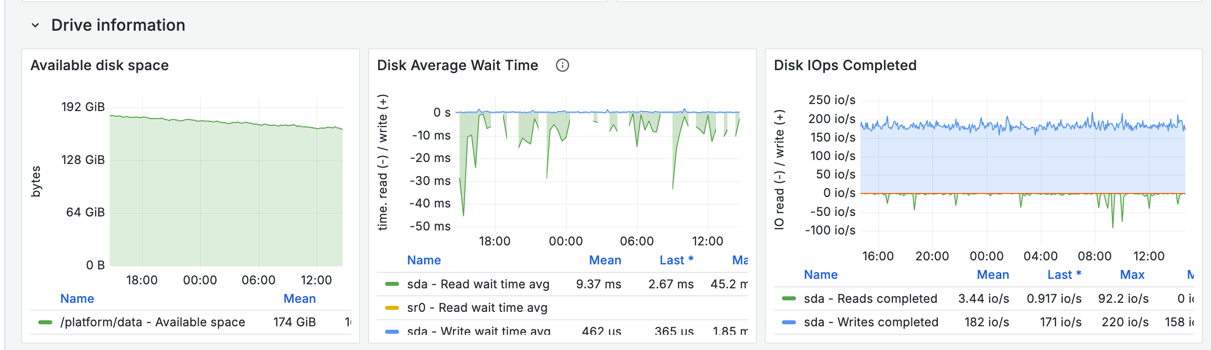
Drive information