Home
The Home Dashboard is the default landing page after logging into Logmanager. It provides quick access to pre-built dashboards and displays real-time metrics about your environment.
You can change the default Home Dashboard in My Profile.
Home Dashboard overview
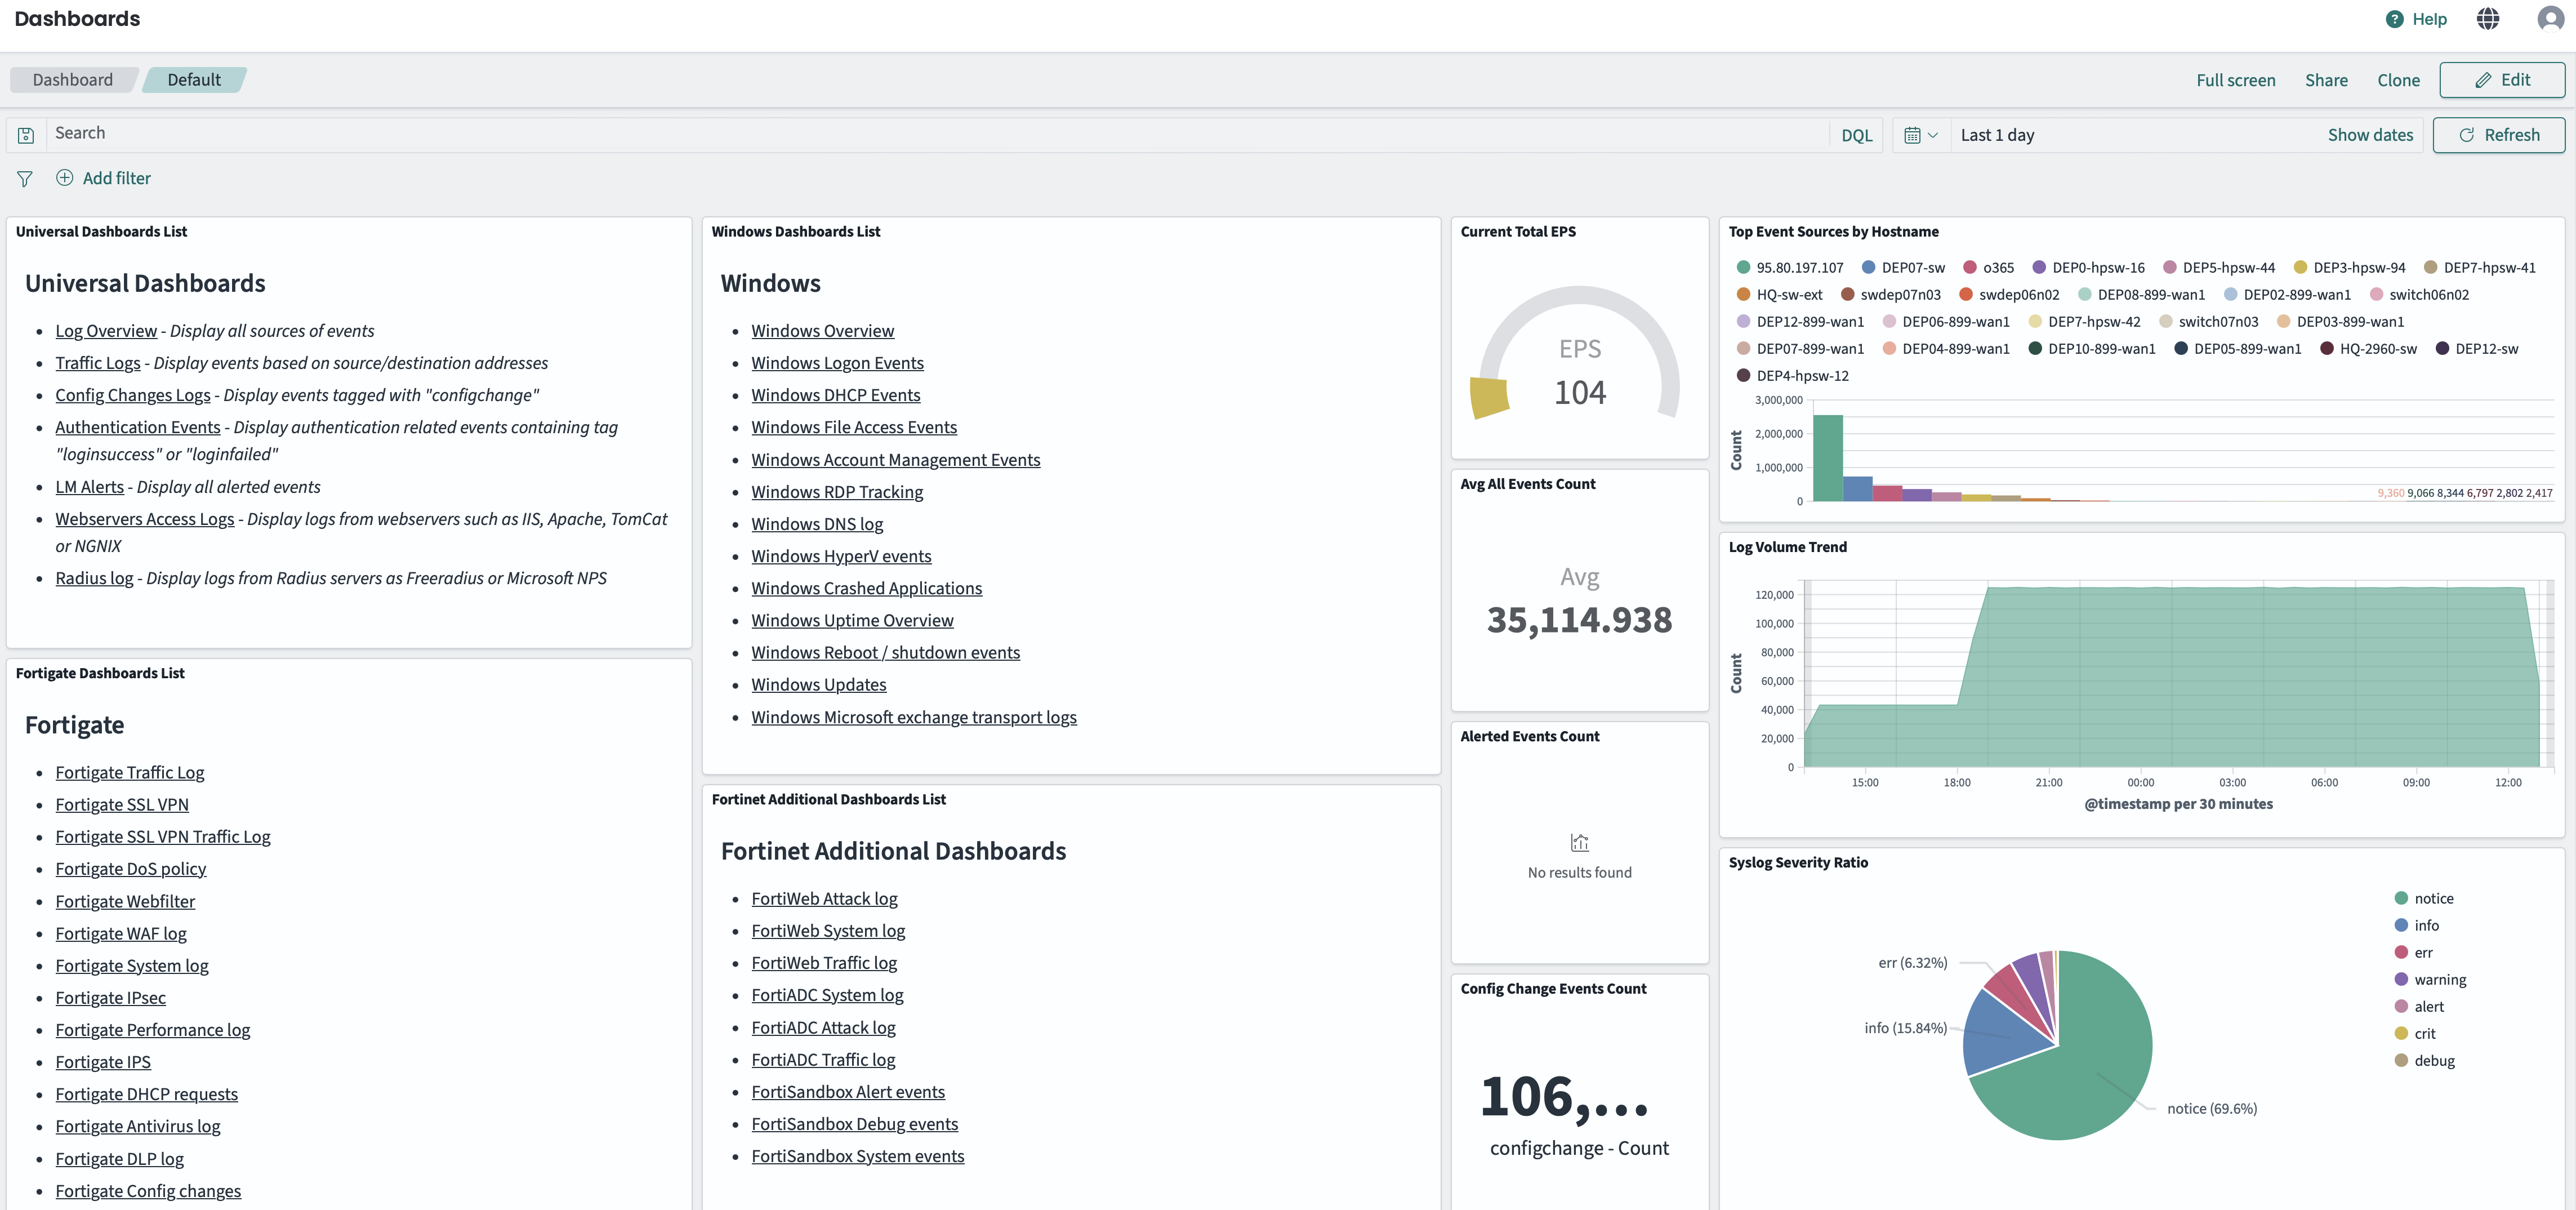
The left side of the Home Dashboard contains categorized lists of pre-built dashboards:
- Universal Dashboards: General-purpose dashboards including Log Overview, Traffic Logs, Config Changes Logs, Authentication Events, LM Alerts, Webservers Access Logs, and Radius log.
- Windows Dashboards: Dashboards for Windows events such as Logon Events, DHCP Events, File Access Events, Account Management, RDP Tracking, DNS log, HyperV events, Crashed Applications, and more.
- Fortigate Dashboards: Dashboards for Fortinet FortiGate devices including Traffic Log, SSL VPN, DoS policy, Webfilter, WAF log, IPS, IPsec, and others.
- Fortinet Additional Dashboards: Dashboards for other Fortinet products like FortiWeb, FortiADC, and FortiSandbox.
- CheckPoint Dashboards: Dashboards for CheckPoint devices including Traffic log and IPS log.
- VMware Dashboards: Dashboards for VMware environments including Overview, Status Change, Users Sessions, and Virtual Machines.
- O365 Dashboards: Dashboards for Microsoft 365 services including Overview, Exchange, OneDrive, PowerBI, SharePoint, AzureActiveDirectory, MicrosoftTeams, and Copilot.
- HP Dashboards: Dashboards for HP devices including All Events and Config changes.
- Juniper Dashboards: Dashboards for Juniper SRX devices including Config change, System log, and Traffic log.
- Linux Dashboards: Dashboards for Linux systems including Squid Proxy, SSH server, ISC DNS server, ISC DHCP server, and Bash Activity.
- Cisco Dashboards: Dashboards for Cisco devices including ASA, Network errors, Config changes, All Events, 802.1x and MAB, and Spanning Tree activity.
- Sysmon Dashboards: Dashboards for Windows Sysmon including Overview, Registry actions, WMI events, File events, and Process Events.
- Other Dashboards: Additional dashboards including CEF Overview, CEF Tipping point, Azure Log Overview, Progress FlowMon ADS, and SQL Component Overview.
Click on any dashboard name to open it.
The right side displays real-time metrics panels:
- Current Total EPS: Events per second being processed.
- Top Event Sources by Hostname: Most active log sources.
- Avg All Events Count: Average event count over the selected time period.
- Log Volume Trend: Visual trend of log volume over time.
- Alerted Events Count: Number of events that triggered alerts.
- Config Change Events Count: Number of configuration change events.
- Syslog Severity Ratio: Distribution of events by syslog severity level.
- Parsers heatmap: Visual representation of parser activity.
- Tags: Quick access to filter events by configured tags.