Discover
Search, filter or visualise your data.
Discover allows users to explore, search, and analyze data stored in Logmanager indices. It’s designed to help users quickly find relevant information, understand data patterns, and drill down into specific logs or fields.
- Exploratory analysis: Quickly understand the structure and content of your data.
- Troubleshooting: Inspect individual logs to debug issues or validate data quality.
- Ad-hoc reporting: Generate on-the-fly reports or insights without building a full dashboard.
- Interactive Data Exploration
- Search Bar: Enter queries using the OpenSearch Query DSL or Lucene syntax to filter data.
- Free text (e.g., FlightDelay:true)
- DSL (Domain Specific language) to create complex, fully customizable queries.
- DQL (Dashboards Query Language) (e.g., FlightDelay:true AND DestCountry: US AND FlightDelayMin >= 60)
- Lucene syntax for advanced queries
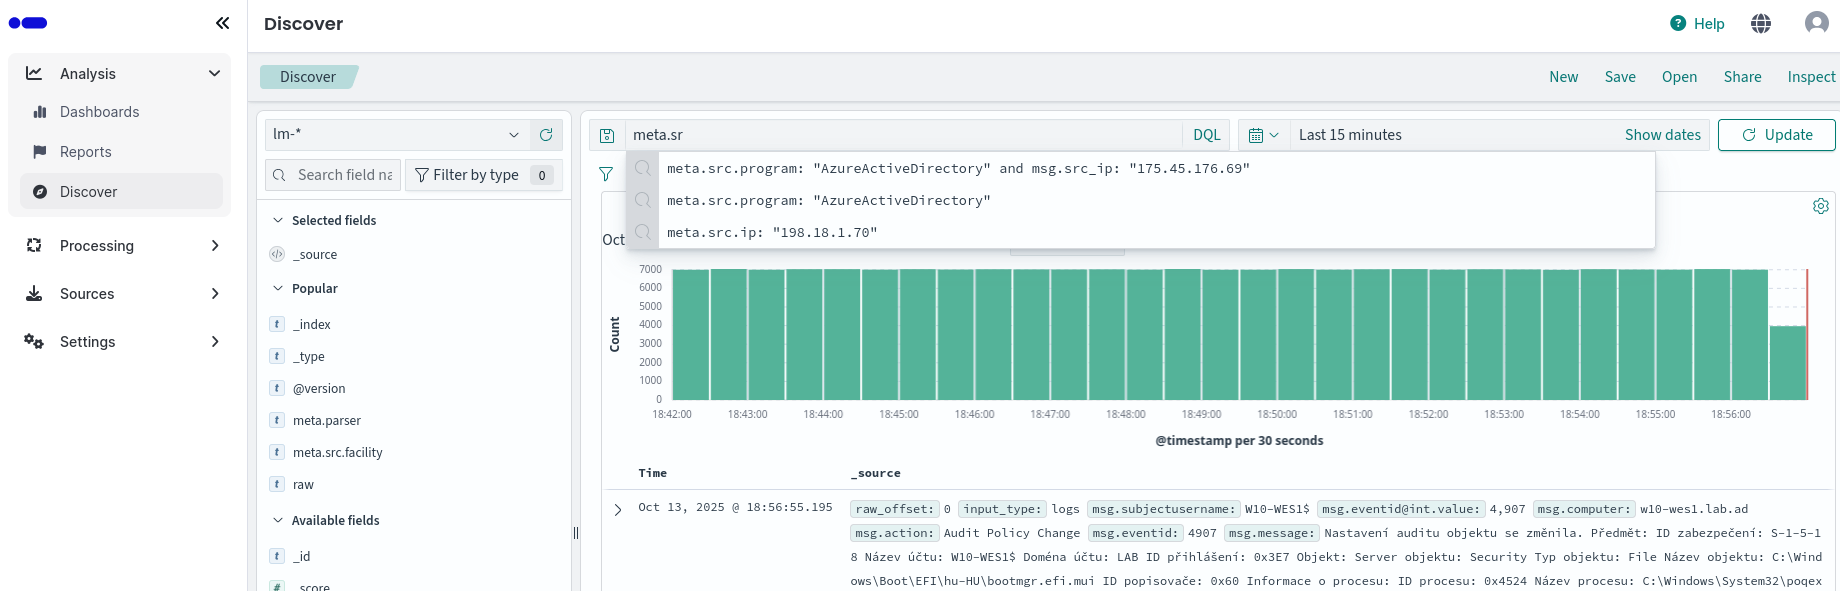
Search bar
- Time Picker: Narrow results to a specific time range, useful for time-series data. Adjust the time filter (e.g., “Last 7 days”) to focus on a specific period.
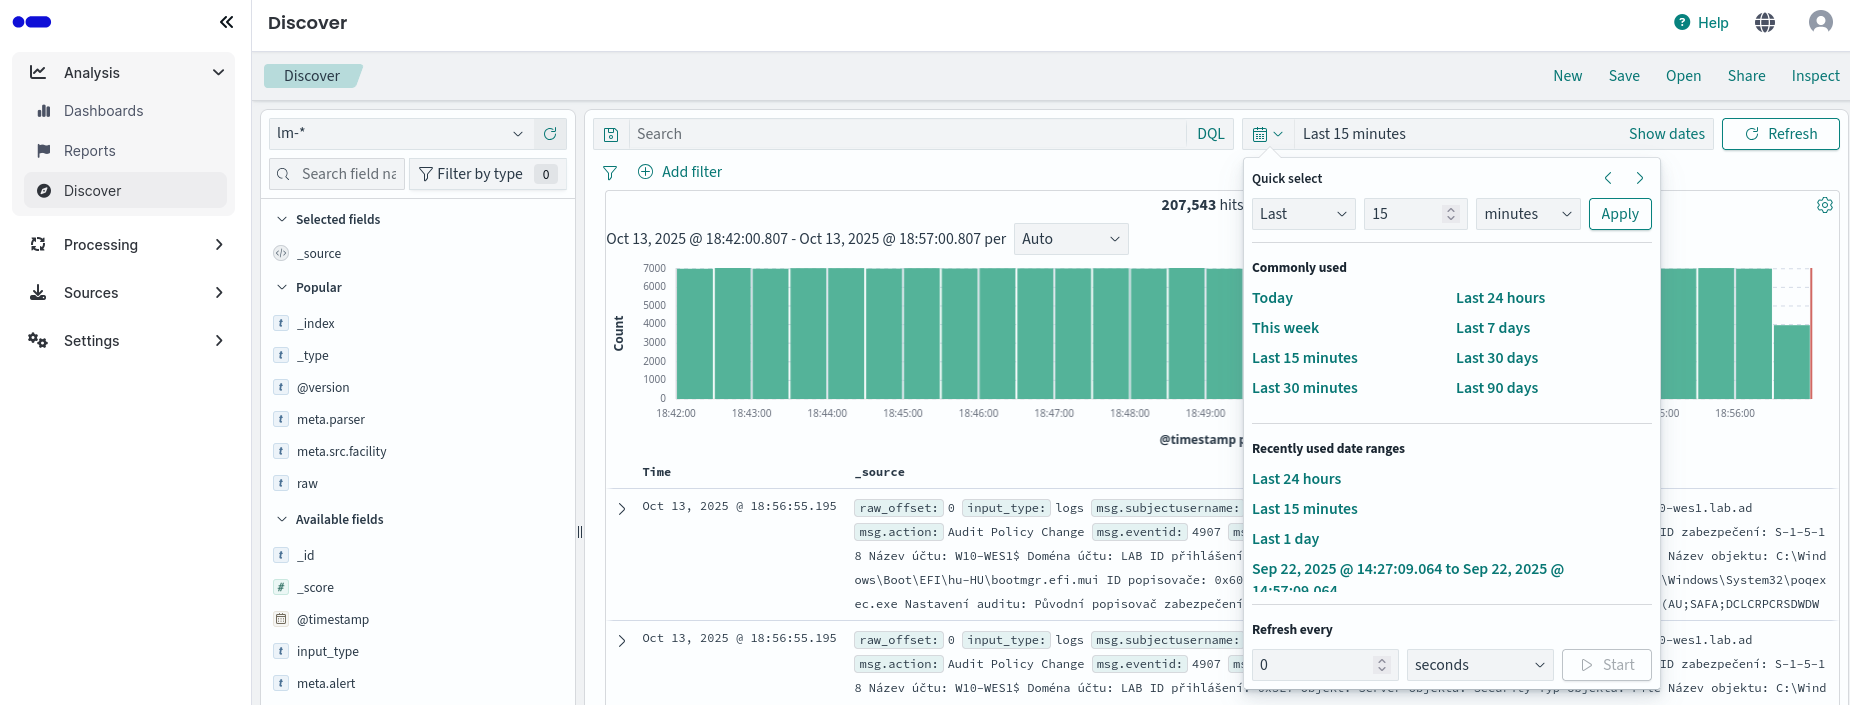
Time picker
- Field Filtering: Select which fields to display or hide, focusing on what’s relevant.
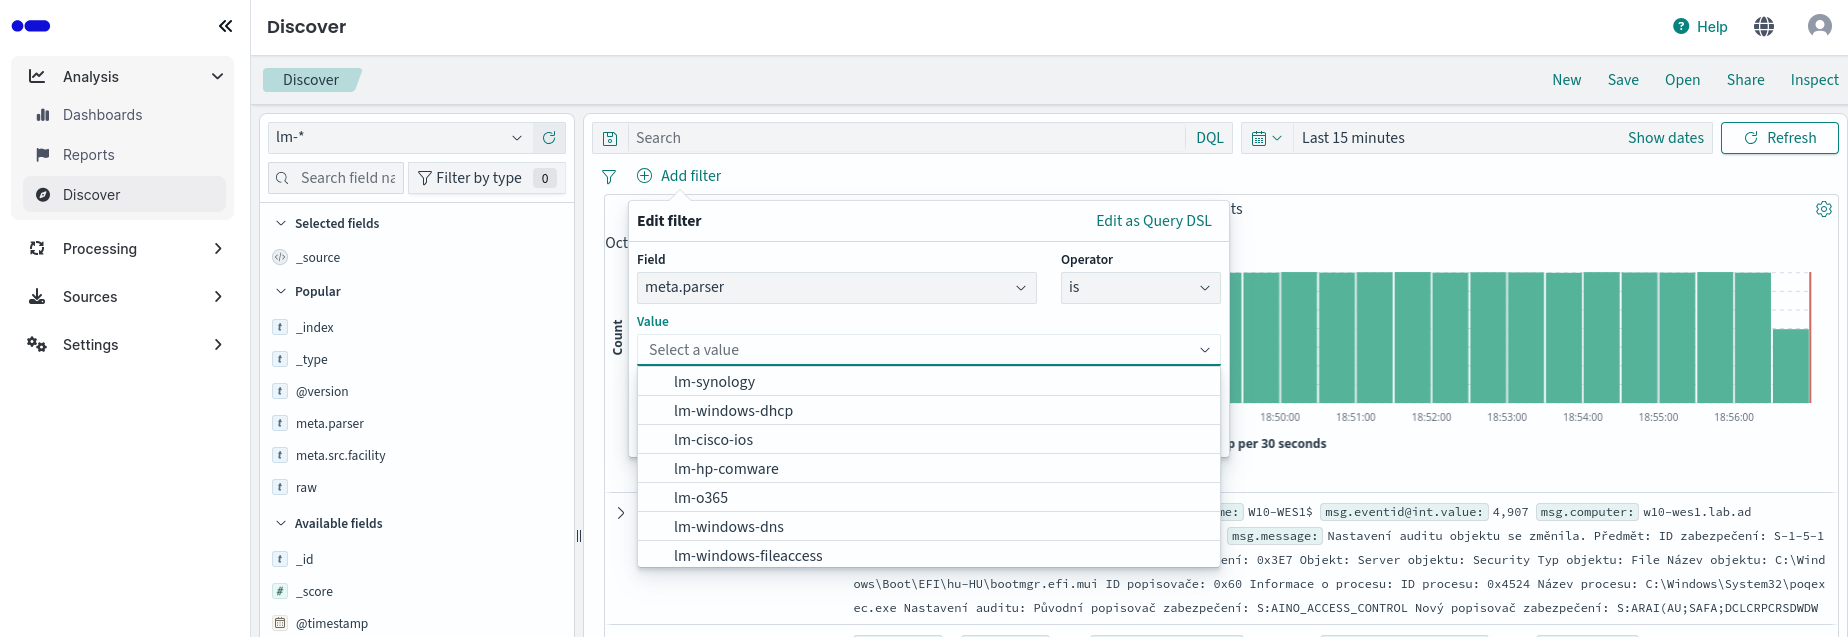
Filter filtering
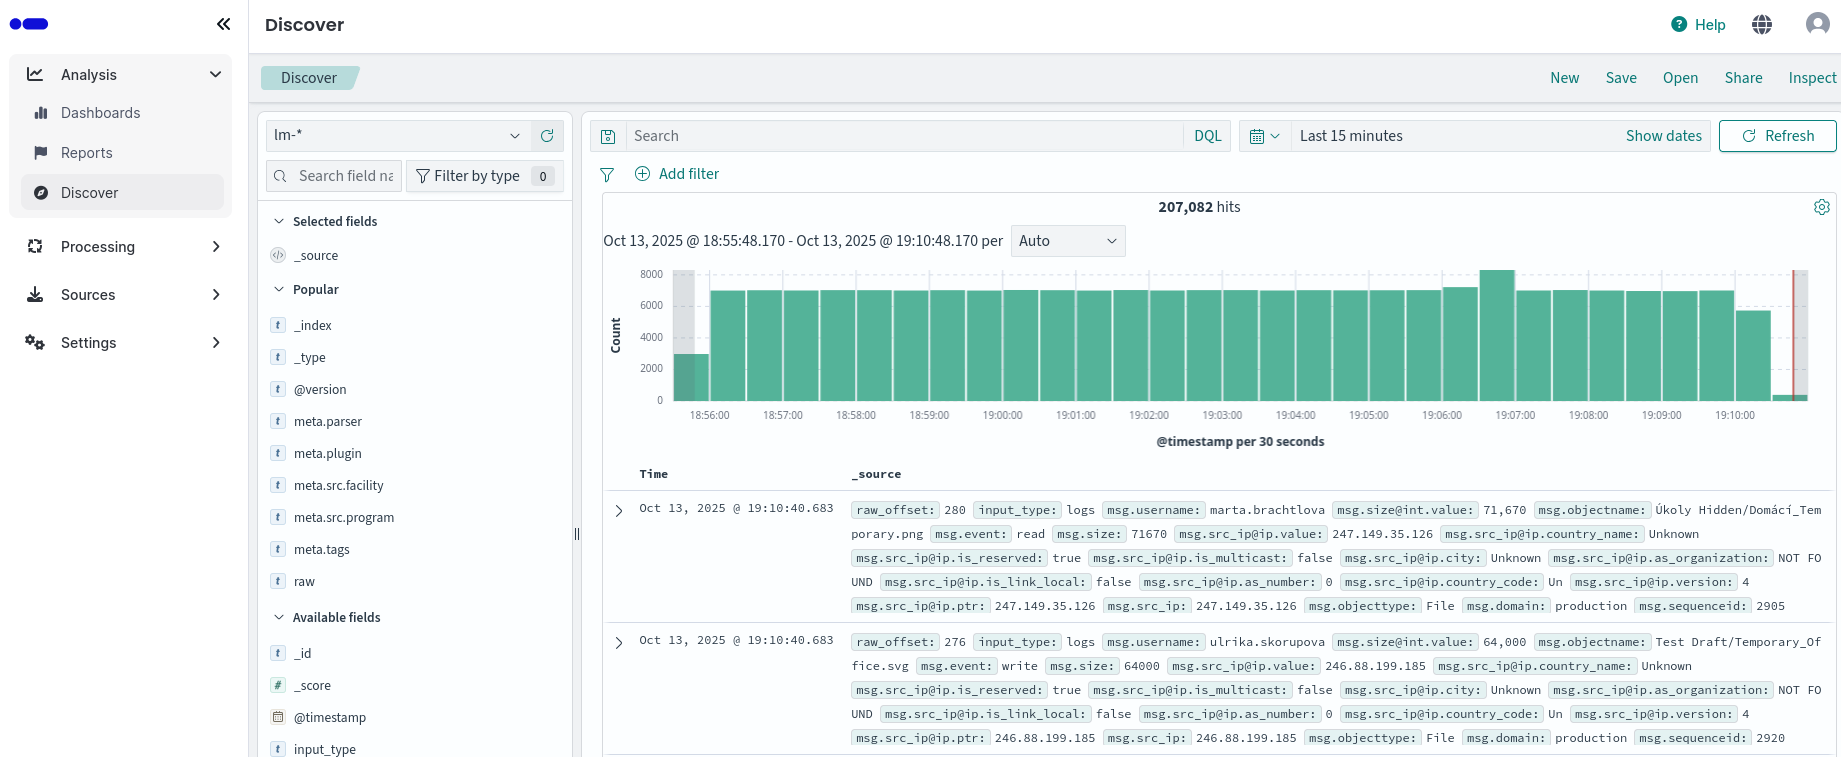
- Document View
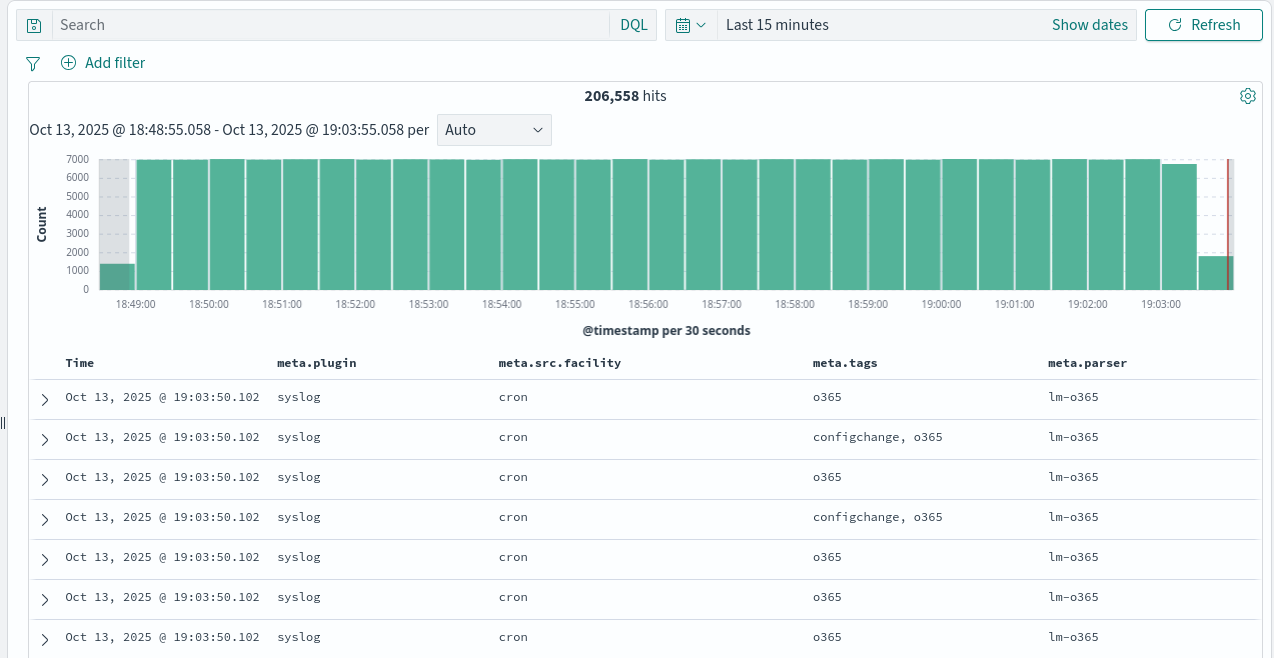
- Tabular Display: View search results as a table, with each row representing a log.
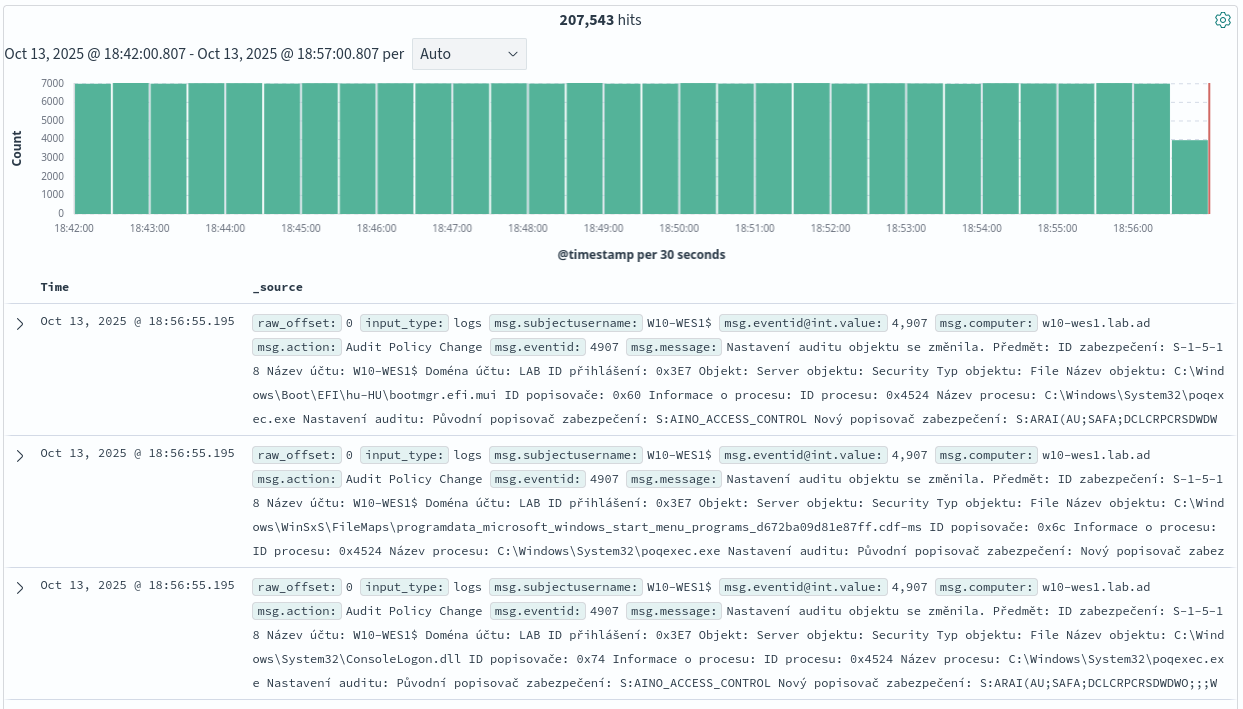
Tabular display
- Expand Documents: Click on any log to see its full details in JSON format.
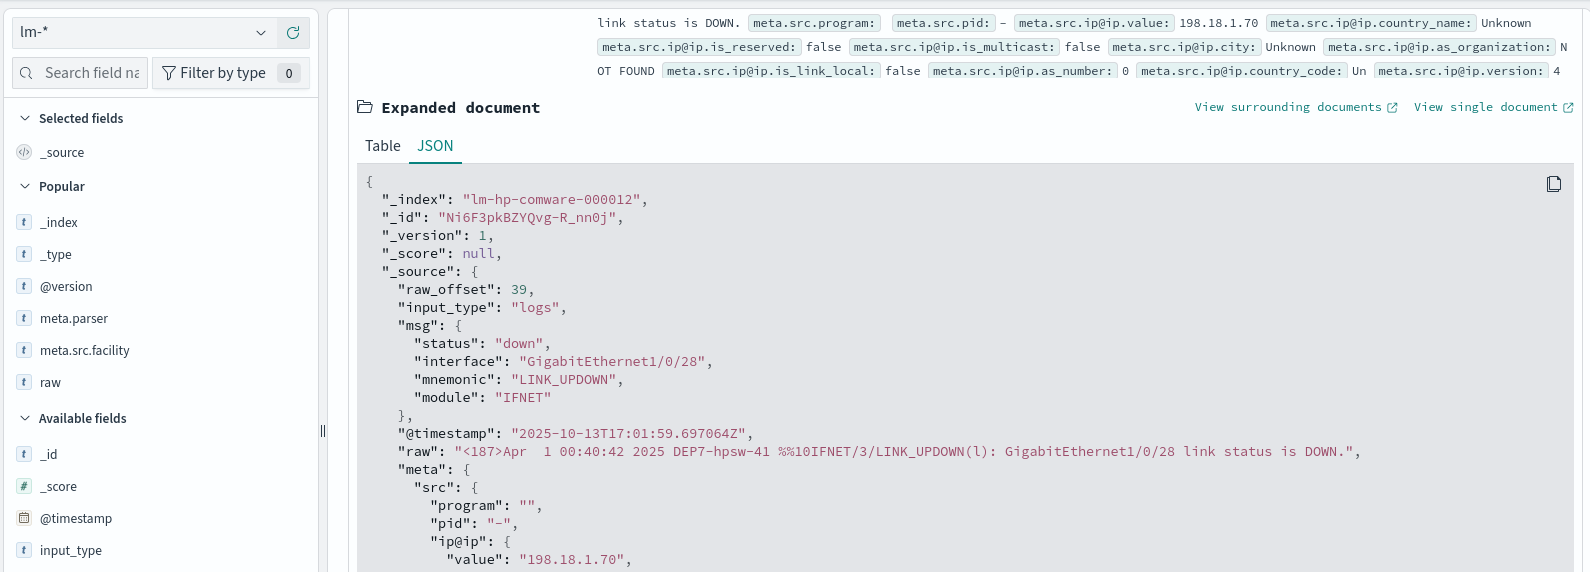
Expand documents
- Custom Columns: Add, remove, or reorder columns to tailor the view.
Custom columns
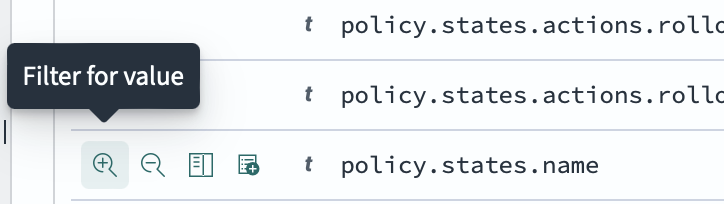
- On hover Quick options: Do quick update on filter or columns within document view
- Filter for value
- Filter out value
- Add or remove field from table column
- Filter for particular field present
Quick options
- Side Panel
- Index Pattern: An index pattern is a string that matches one or more Logmanager indices (e.g., lm-windows, lm-mikrotik). It allows you to search and analyze data across multiple indices which match index pattern name. Index Pattern is like a view or a virtual database that can span multiple tables (indices) and allows flexible querying without strict schema constraints. When unsure where to start, pick from
lm-*orunparsed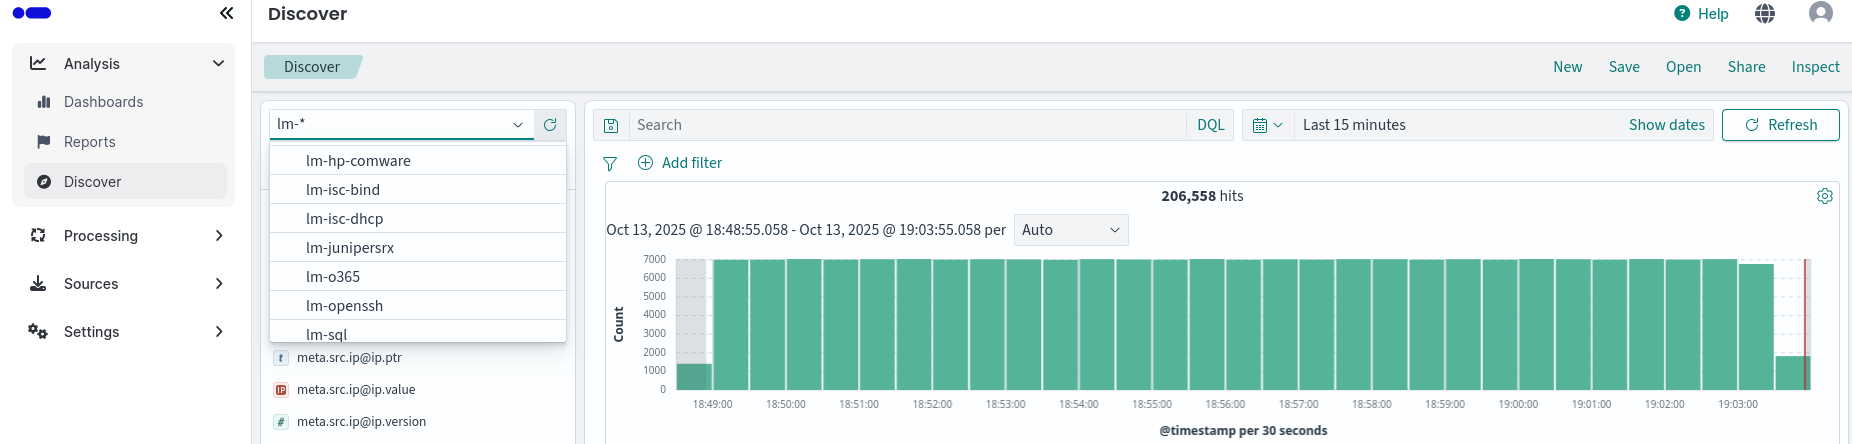
Index pattern
- Fields Listing: The left panel lists all the fields (columns) available in your index pattern, grouped by type:
- Available fields: All fields in your data, including text, numbers, dates, booleans, and more.
- Popular fields: Frequently used or high-cardinality fields.
- Field types: Icons or labels indicate the data type (e.g., string, number, date, IP, etc.).
Fields listing
- Aggegate & Analyze: Quickly generate charts or graphs from aggregations for visual analysis.
- View field statistics: Hover over a field to see basic stats (e.g., count, min/max for numbers).
- Create visualizations: Click the “Visualize” button next to a field to quickly generate a chart or graph.
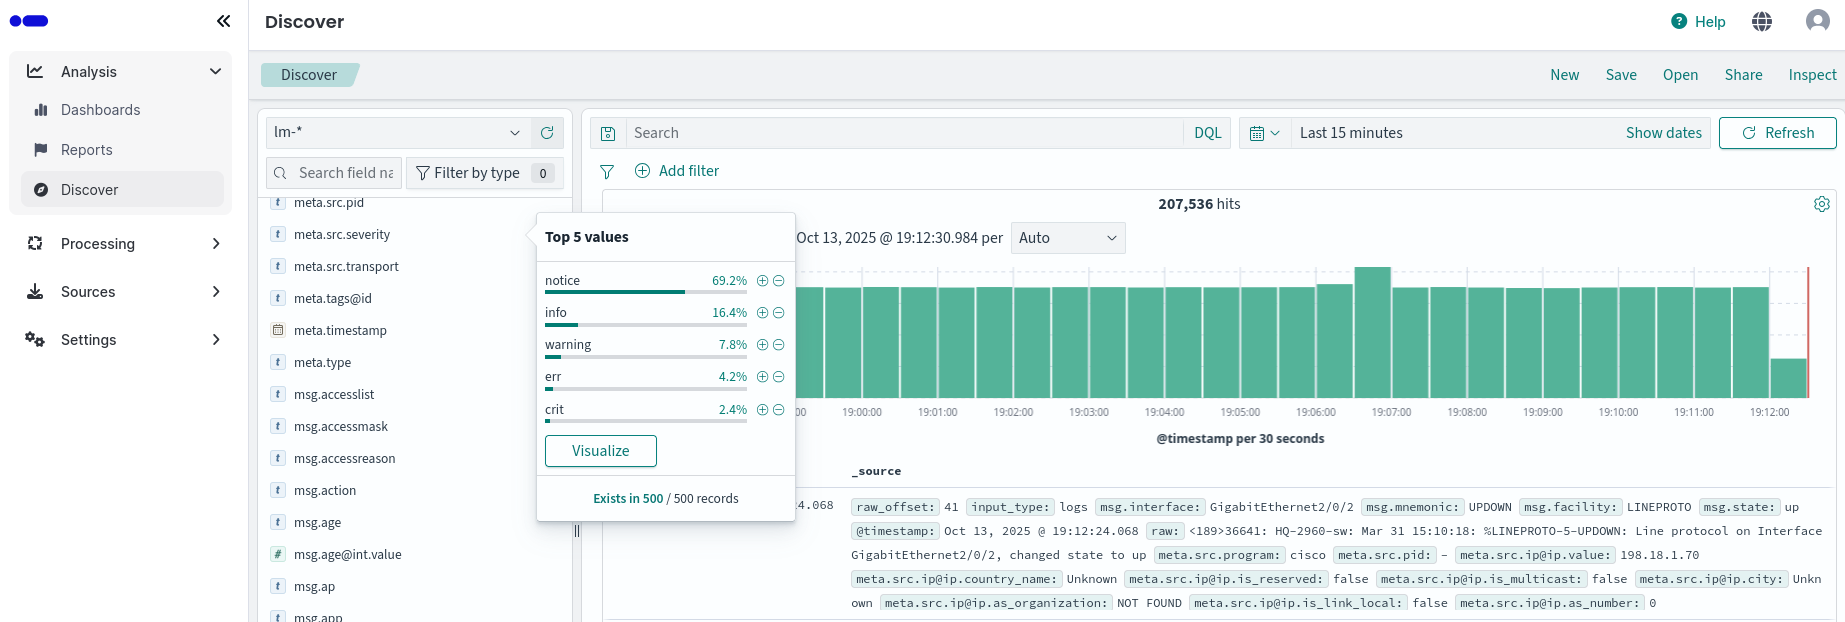
Aggegate and analyze
- Saved Searches
- Save & Reuse: Save your search criteria, filters, and columns for future use or sharing with your team.

Save and reuse
Logmanager allows exporting data in CSV and XLSX formats from two sections of the web interface:
- Discover section
- Reporting section
For export in Discover section follow these steps:
- First, select the fields that should be included in the export
- Next, set the time range from which the data should come.
- Save the current search to preserve the configuration of fields, filters, and the time range for generating the report.
- Optional: apply filters to narrow down the data set.
- Open the Reporting menu in the top navigation.
- From the menu, choose Generate CSV or Generate XLSX.
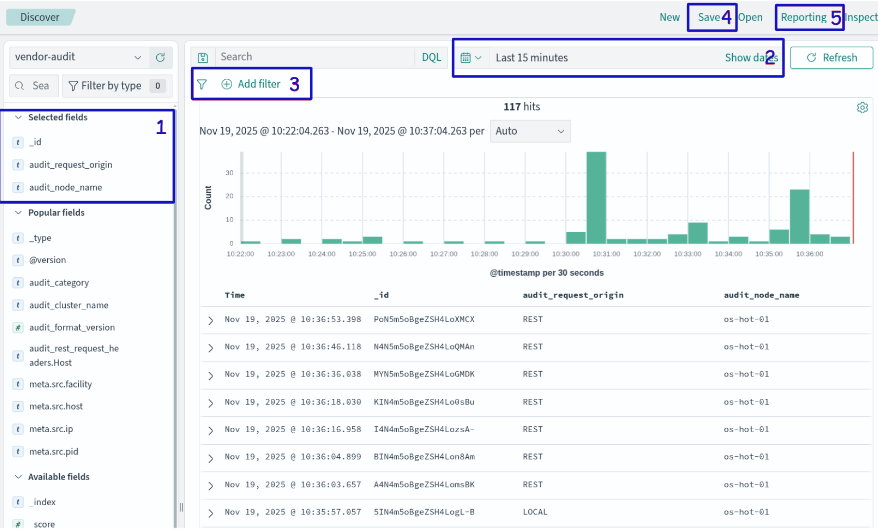
Exporting data from Discover section
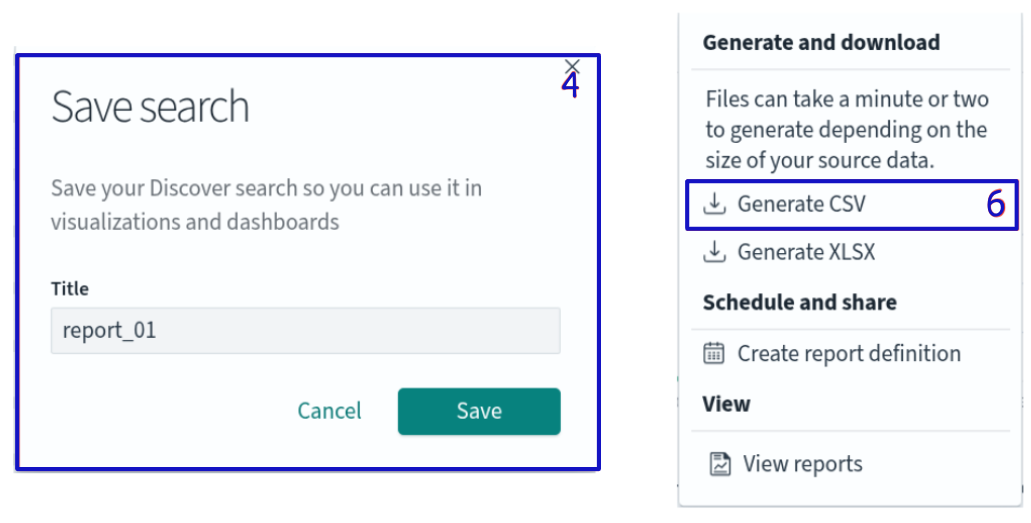
Exporting data from Discover section (pop-up)
The exported data are available for download in the form of reports in Reporting section section from the main menu under the name On_demand_report.
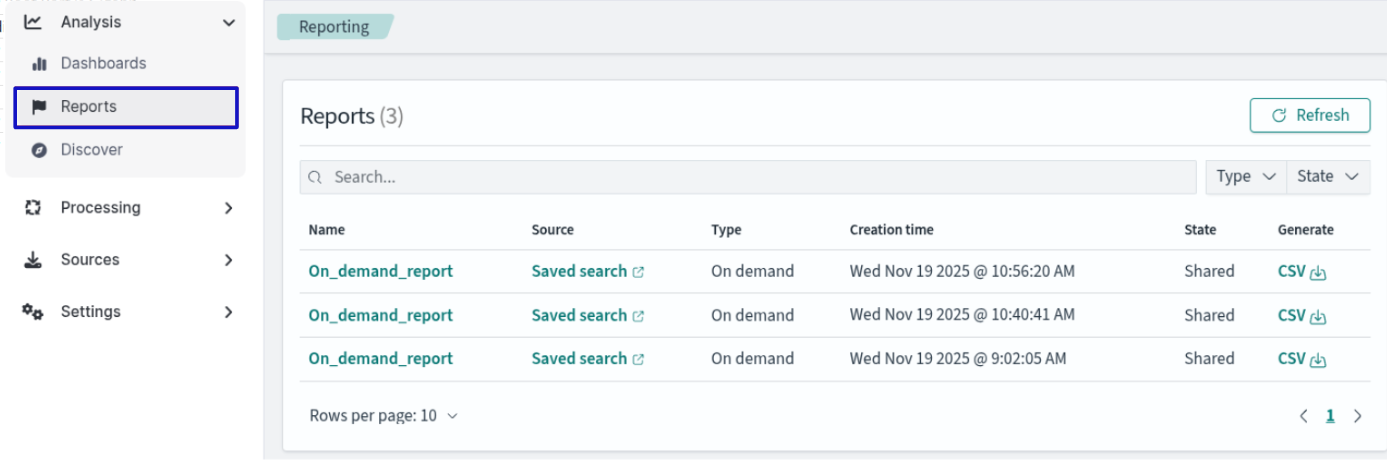
Exported data in reports
When importing CSV into Microsoft Excel, choose UTF-8 encoding in the import wizard.
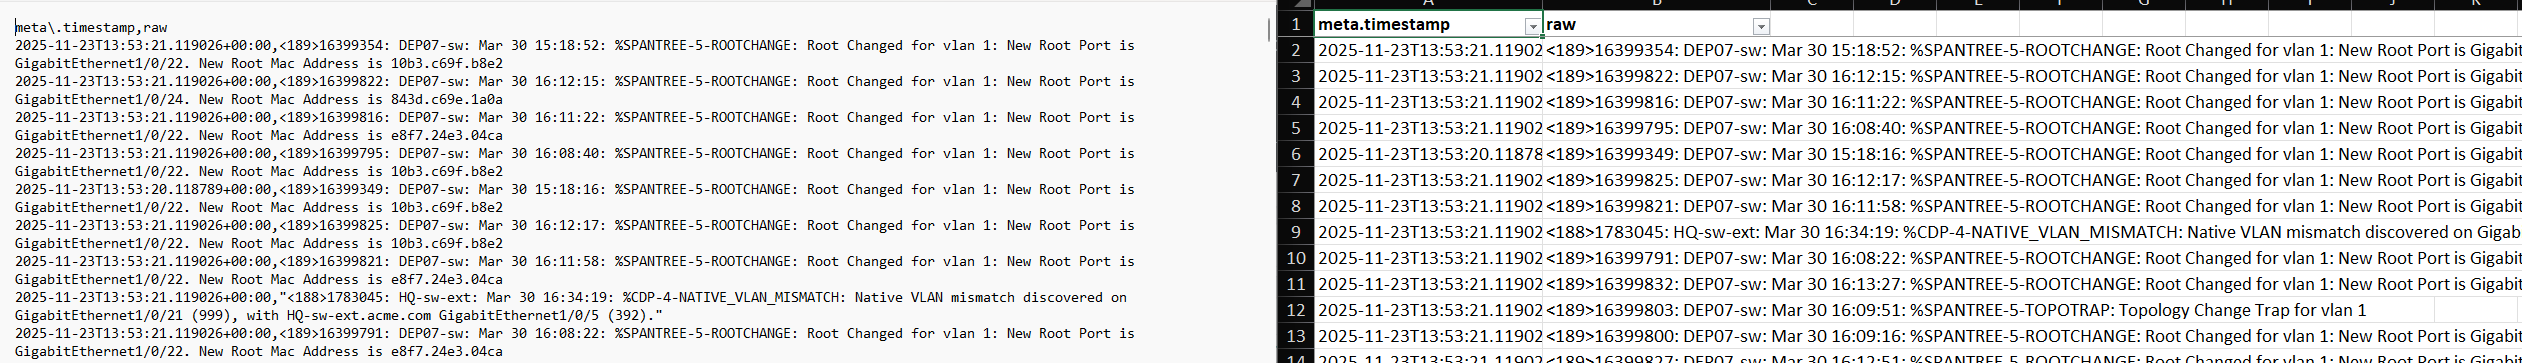
Exported data in CSV and XLSX format