Create New
To create a new dashboard:
- Navigate to Analysis -> Dashboard -> Create New from the main menu.
- An empty dashboard canvas will appear where you can add visualizations.
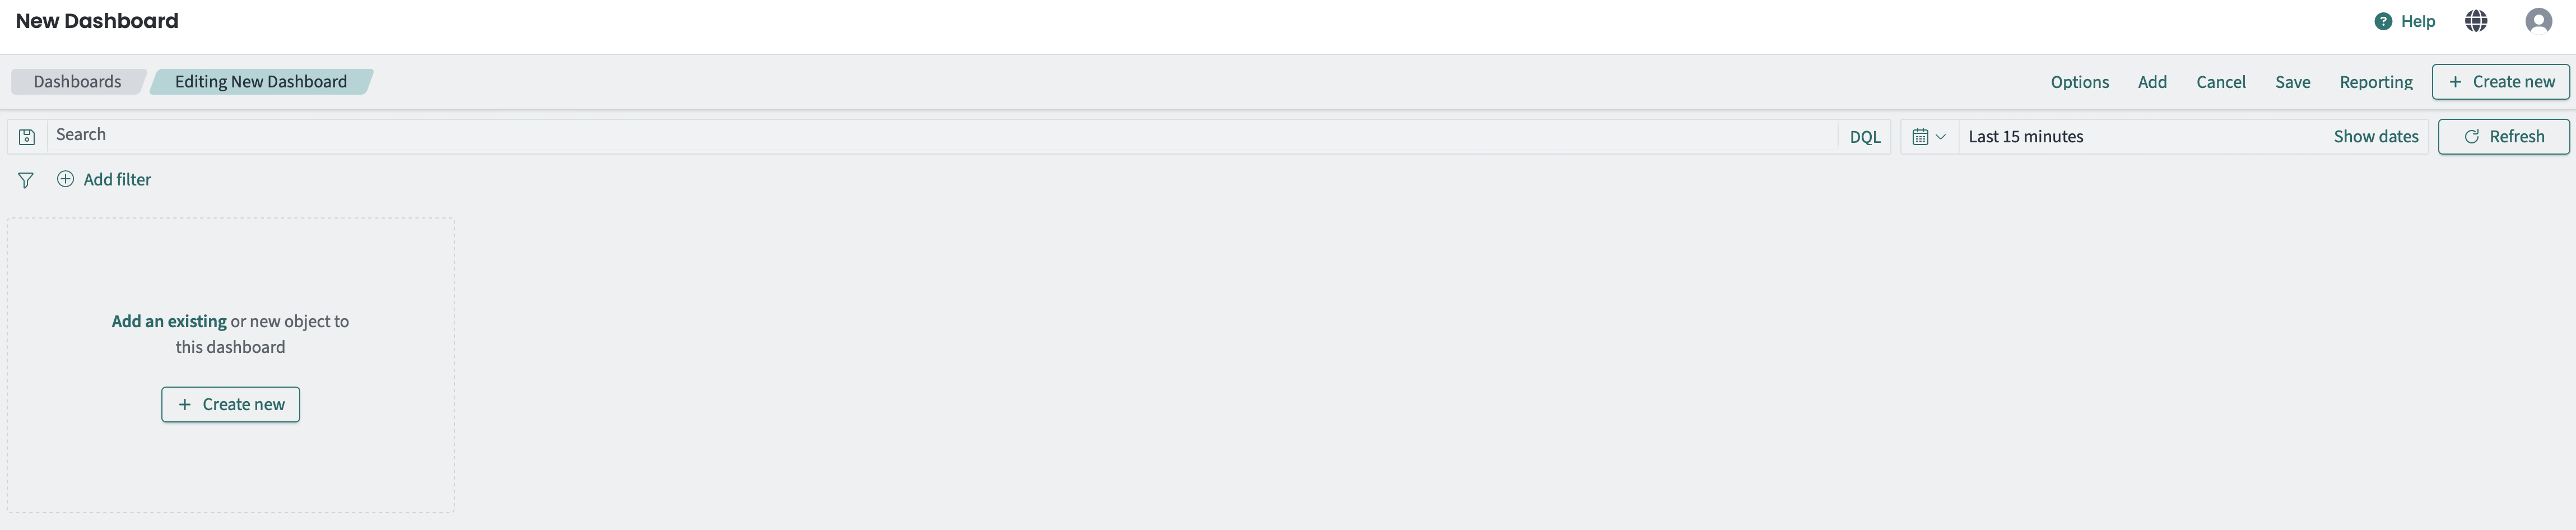
Creating a new dashboard
You can add existing visualizations or create new ones directly from the dashboard:
- Click Add in the top toolbar.
- Select from the list of saved visualizations.
- The visualization will be added to your dashboard.
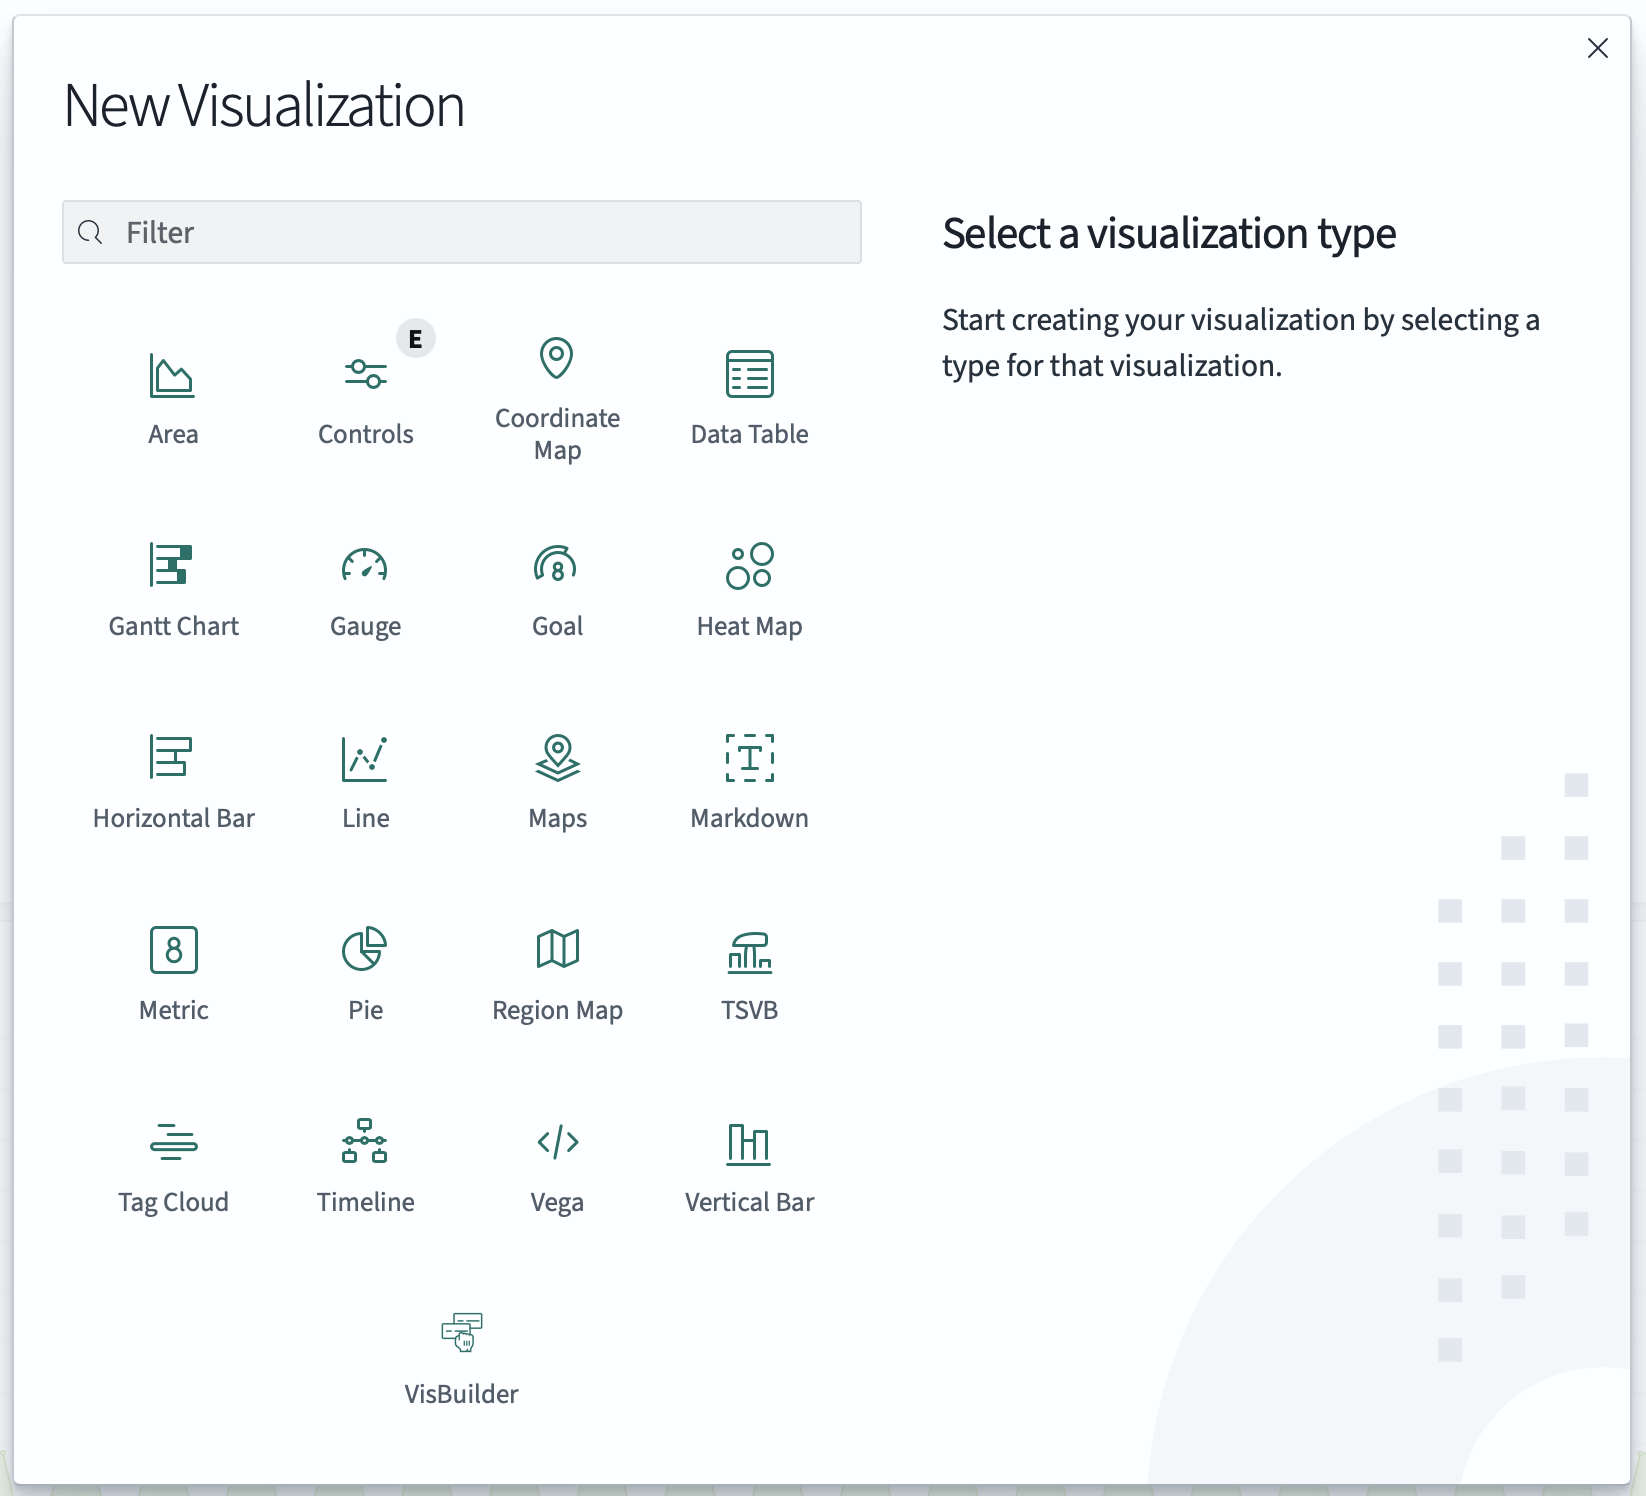
- Click Create new in the add panel.
- Choose the visualization type (area chart, bar chart, pie chart, data table, etc.).
- Configure the visualization with your desired metrics and aggregations.
- Save the visualization and it will appear on your dashboard.
For a complete list of available visualization types, see Create New in the Dashboard documentation.
Adding visualizations to dashboard
- Click Save in the top toolbar.
- Enter a title and optional description.
- Choose whether to save the current time range and filters.
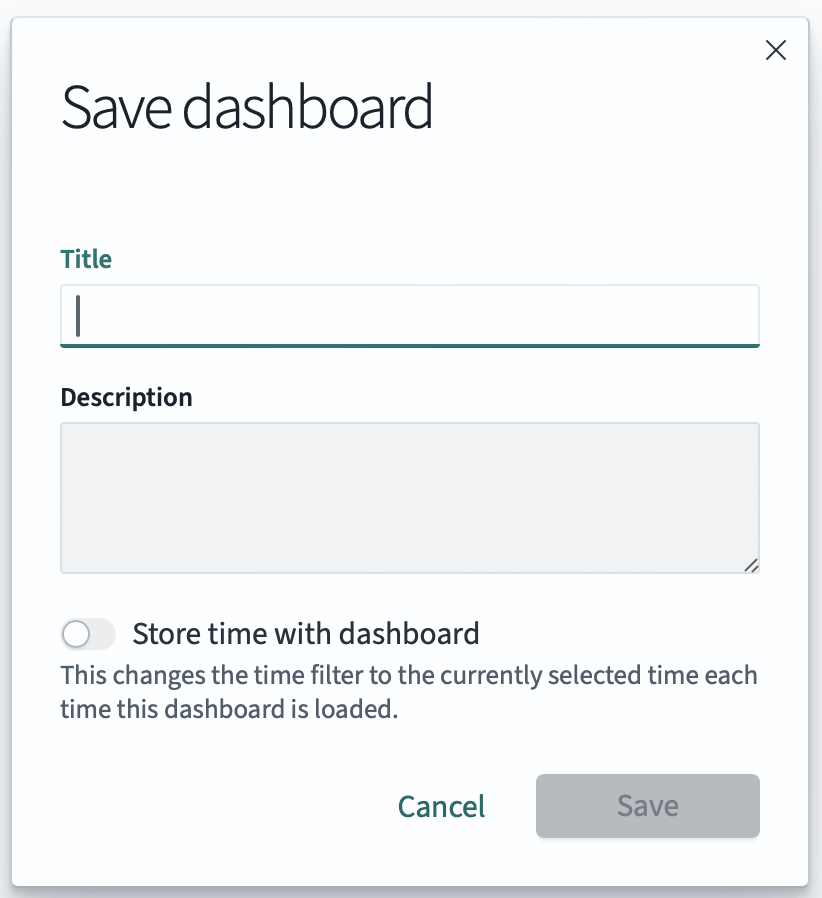
Saving a dashboard